
Product
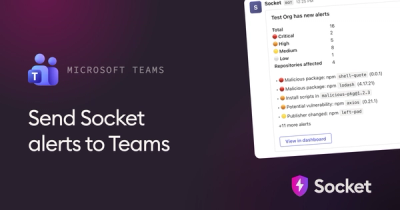
Microsoft Teams Notifications Are Now Available in Socket
Socket can now send alerts and supply chain attack notifications to Microsoft Teams, with filters that route the right updates to each channel.
By Jeppe Hasseriis - Sep 01, 2026
tracebug-sdk
Advanced tools
Zero-backend, browser-only SDK that records user sessions and generates bug reproduction steps. Data stays in localStorage.
One-stop bug reproduction tool for QA testers and developers. Records user sessions, captures screenshots, and auto-generates developer-ready bug reports — all in the browser.
Minimum effort from tester. Maximum debugging output for developer.
No servers. No databases. No API keys. Just install and go.
Works with any frontend framework: React, Angular, Vue, Next.js, Nuxt, Vite, Svelte, SvelteKit, Remix, Astro, or plain HTML.
Tester uses the app normally
↓
SDK silently captures: clicks, inputs, navigation, API calls, errors, environment
↓
Tester finds a bug → clicks 📸 Screenshot → adds a note or 🎤 voice description
↓
Clicks "GitHub Issue" or "Jira Ticket"
↓
Complete bug report copied to clipboard:
- Auto-generated title
- Steps to reproduce
- Screenshots with annotations
- Voice bug description
- Console errors + stack traces
- Failed network requests
- Environment (browser, OS, viewport)
- Full session timeline
↓
Paste into GitHub/Jira → Developer has everything. No back-and-forth.
Install the SDK in your project — best for teams who want TraceBug always active on dev/staging.
npm install tracebug-sdk
import TraceBug from "tracebug-sdk";
TraceBug.init({ projectId: "my-app" });
Install the browser extension — no code needed. QA testers, PMs, and clients can use it on any website.
tracebug-extension/ folderchrome://extensions/ → Enable Developer modetracebug-extension folderWorks on Chrome, Edge, Brave, and Opera.
| What | Details |
|---|---|
| Clicks | Element tag, text, id, className, aria-label, role, data-testid, href, button type |
| Inputs | Field name, type, value (sensitive fields auto-redacted), placeholder |
| Dropdowns | Selected option text + value, all available options |
| Form Submits | Form id, action, method, all field values (passwords redacted) |
| Navigation | Route from → to (supports pushState, replaceState, popstate) |
| API Requests | URL, method, status code, response time (both fetch and XMLHttpRequest) |
| Errors | Message, stack trace, source file, line, column |
| Console Errors | console.error() calls |
| Unhandled Rejections | Promise rejection reason + stack |
| Environment | Browser, OS, viewport, device type, connection, language, timezone |
| Tool | What it does |
|---|---|
| 📸 Screenshot | Captures page screenshot with auto-generated name (e.g., 01_click_add_vendor.png) |
| 📝 Add Note | Tester adds Expected/Actual/Severity — becomes part of the bug report |
| 🐙 GitHub Issue | Generates complete GitHub issue markdown — copies to clipboard |
| 🎫 Jira Ticket | Generates Jira-compatible ticket with priority, labels, description |
| 🎤 Voice Note | Speak to describe the bug — speech-to-text, auto-included in reports |
| 📄 PDF Report | Opens printable bug report — save as PDF from browser |
| Output | Details |
|---|---|
| Bug Title | Smart title from session context (e.g., "Vendor Update Fails — TypeError") |
| Repro Steps | Numbered steps generated from event timeline |
| Session Timeline | Debug timeline with elapsed timestamps for every event |
| Environment Snapshot | Browser version, OS, viewport, device type, connection |
npm install tracebug-sdk
npm install github:prashantsinghmangat/tracebug-ai
See Chrome Extension section below.
TraceBug.init({
  projectId: "my-app",        // Required: identifies your app
  maxEvents: 200,             // Max events per session (default 200)
  maxSessions: 50,            // Max sessions in localStorage (default 50)
  enableDashboard: true,      // Show the floating bug button (default true)
  enabled: "auto",            // Control when SDK is active (see below)
});
enabled option| Value | Behavior |
|---|---|
"auto" | Enabled in dev/staging, disabled in production (default) |
"development" | Only when NODE_ENV is "development" |
"staging" | Dev + staging hosts (staging, stg, uat, qa in hostname) |
"all" | Always enabled, including production |
"off" | Completely disabled |
string[] | Custom hostnames, e.g. ["localhost", "staging.myapp.com"] |
import TraceBug from "tracebug-sdk";

TraceBug.pauseRecording();
TraceBug.resumeRecording();
TraceBug.isRecording();
TraceBug.getSessionId();
TraceBug.destroy();
// Capture screenshot (auto-named from last event context)
const screenshot = await TraceBug.takeScreenshot();
// → { filename: "01_click_add_vendor.png", dataUrl: "data:image/png;...", ... }

const allScreenshots = TraceBug.getScreenshots();
// Check if voice recording is supported in the browser
if (TraceBug.isVoiceSupported()) {
  // Start recording — speech-to-text via Web Speech API (free, no API keys)
  TraceBug.startVoiceRecording({
    onUpdate: (text, interim) => console.log("Transcript:", text),
    onStatus: (status, msg) => console.log("Status:", status),
  });

  // Stop recording — returns the transcript
  const transcript = TraceBug.stopVoiceRecording();
  // → { id, timestamp, text: "When I click update the page breaks", duration }

  // Get all voice transcripts
  TraceBug.getVoiceTranscripts();
}
Voice transcripts are automatically included in GitHub Issue, Jira Ticket, and PDF reports.
TraceBug.addNote({
  text: "Button doesn't respond after selecting Inactive status",
  expected: "Vendor should update successfully",
  actual: "App throws TypeError and freezes",
  severity: "critical",  // "critical" | "major" | "minor" | "info"
});
// Generate complete bug report object
const report = TraceBug.generateReport();

// Get auto-generated bug title
const title = TraceBug.getBugTitle();
// → "Vendor Update Fails — TypeError"

// Get GitHub issue markdown (copies to clipboard in dashboard)
const markdown = TraceBug.getGitHubIssue();

// Get Jira ticket payload
const ticket = TraceBug.getJiraTicket();
// → { summary, description, environment, priority, labels }

// Download PDF report
TraceBug.downloadPdf();

// Get environment info
const env = TraceBug.getEnvironment();
// → { browser: "Chrome", browserVersion: "122", os: "Windows 10/11", ... }
import { getAllSessions, clearAllSessions, deleteSession } from "tracebug-sdk";

const sessions = getAllSessions();
const bugs = sessions.filter(s => s.errorMessage);
clearAllSessions();
deleteSession("session-id");
import {
  generateReproSteps,
  captureEnvironment,
  buildReport,
  generateGitHubIssue,
  generateJiraTicket,
  generateBugTitle,
  buildTimeline,
  formatTimelineText,
} from "tracebug-sdk";
The in-browser dashboard includes:
The TraceBug Chrome Extension lets non-developers use all TraceBug features without writing code.
chrome://extensions/tracebug-extension/ folder from this repochrome.scripting.executeScript with world: "MAIN" to bypass Content Security Policy restrictions| Browser | Supported |
|---|---|
| Google Chrome | Yes |
| Microsoft Edge | Yes |
| Brave | Yes |
| Opera | Yes |
| Firefox | Coming soon |
tracebug-extension/ folder# Clone the repo
git clone https://github.com/prashantsinghmangat/tracebug-ai.git
cd tracebug-ai
# Install dependencies
npm install
# Build SDK (produces CJS + ESM + IIFE for extension)
npm run build
# Output:
# dist/index.js — ESM (npm package)
# dist/index.cjs — CJS (npm package)
# dist/index.d.ts — TypeScript declarations
# tracebug-extension/tracebug-sdk.js — IIFE (Chrome Extension)
cd example-app
npm install
npm run dev
# Open http://localhost:3000
/vendorpassword, secret, token, ssn, credit)localStorage — nothing leaves the browser| Format | File | Works with |
|---|---|---|
ESM (import) | dist/index.js | Vite, Next.js, Nuxt, SvelteKit, modern webpack |
CJS (require) | dist/index.cjs | Angular CLI, older webpack, Node.js |
| IIFE (global) | tracebug-extension/tracebug-sdk.js | Chrome Extension, plain <script> tag |
| TypeScript | dist/index.d.ts | Full type support in both ESM and CJS |
npm uninstall tracebug-sdk
Then remove the TraceBug.init() call from your app's entry file.
Go to chrome://extensions/ → click Remove on TraceBug.
MIT
Prashant Singh Mangat
FAQs
Capture a browser bug into one offline .html file your AI coding agent reads over MCP and fixes — session replay, console, network, repro timeline, and a generated failing test. Local-first, zero backend. Free.
The npm package tracebug-sdk receives a total of 14 weekly downloads. As such, tracebug-sdk popularity was classified as not popular.
We found that tracebug-sdk demonstrated a healthy version release cadence and project activity because the last version was released less than a year ago. It has 1 open source maintainer collaborating on the project.
Product
Socket can now send alerts and supply chain attack notifications to Microsoft Teams, with filters that route the right updates to each channel.

Security News
pnpm 12 rewrites the package manager in Rust, cutting install times by up to 90% while preserving pnpm 11 workflows and lockfiles.
Security News
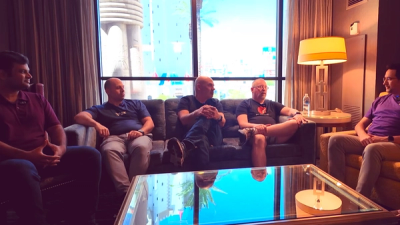
Socket CTO Ahmad Nassri joins AppSec leaders at Black Hat to discuss active malware, package manager risks, and software supply chain defense.