Huge News!Announcing our $40M Series B led by Abstract Ventures.Learn More →
treechartjs
Advanced tools
treechartjs - npm Package Compare versions
Comparing version 0.0.6 to 0.0.7
| { | ||
| "name": "treechartjs", | ||
| "version": "0.0.6", | ||
| "version": "0.0.7", | ||
| "description": "Generate tree chart based on structured data, and support node expansion/collapse, and edit nodes through API or drag-and-drop behavior", | ||
@@ -8,4 +8,3 @@ "main": "dist/index.js", | ||
| "dev": "cross-env NODE_ENV=development rollup -c --watch", | ||
| "build": "rollup -c", | ||
| "publish": "npm run build&npm publish" | ||
| "build": "rollup -c" | ||
| }, | ||
@@ -12,0 +11,0 @@ "repository": { |
| # treechartjs | ||
| `treechartjs` can generate tree diagrams based on structured data, and supports node expansion/collapse. Nodes can be edited through API or drag-and-drop behavior. Its size is very small and has no dependencies. The size after construction is only 25KB. | ||
| `treechartjs` can generate tree diagrams based on structured data, and supports node expansion/collapse. Nodes can be edited through API or drag-and-drop behavior. Its size is very small and has no dependencies. The size after construction is only 25KB.[[中文文档](https://github.com/grajs/treechartjs/blob/master/doc/README.zh.md)] | ||
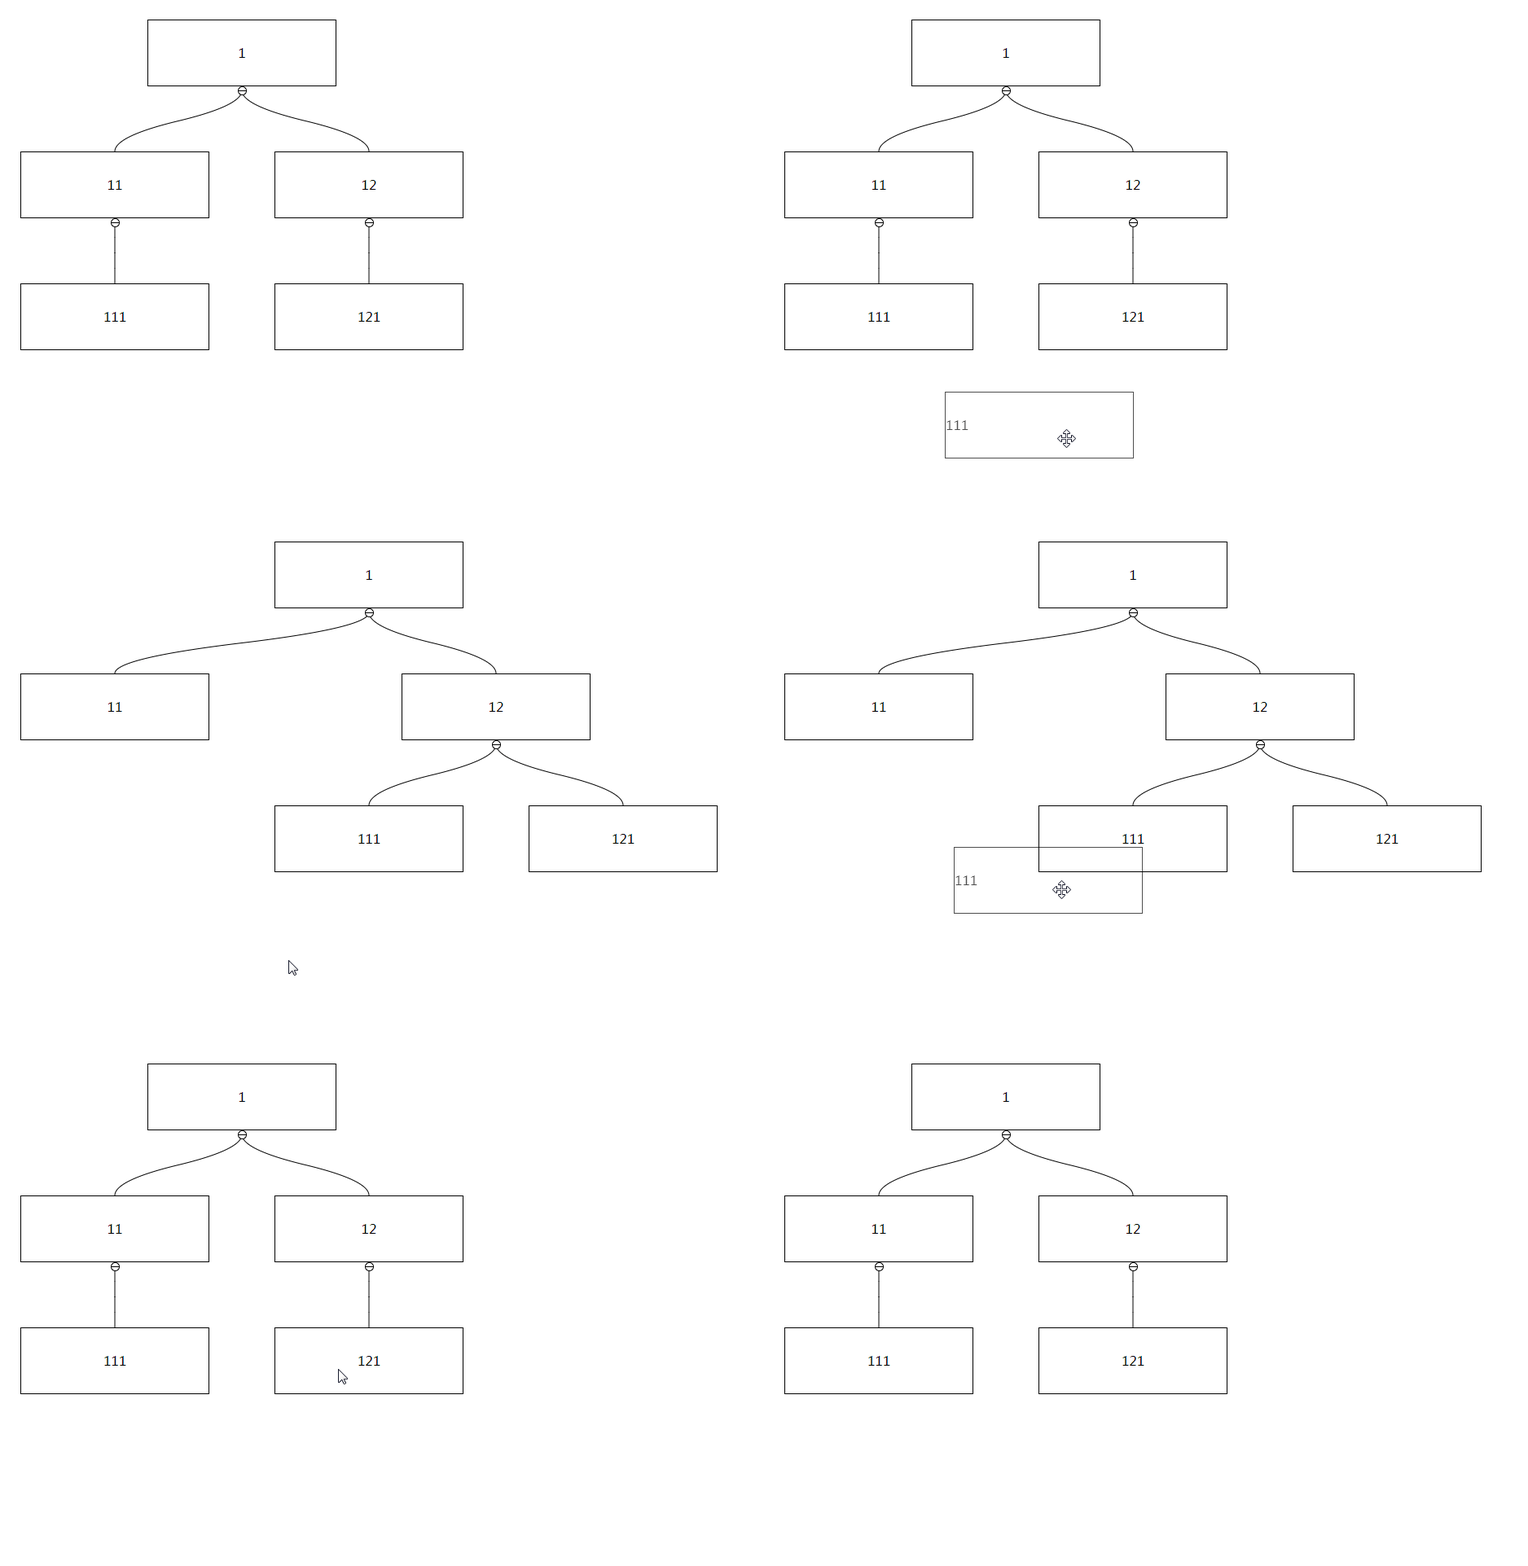
@@ -75,3 +75,3 @@  | ||
| The parent element of the chart. After initialization, the class name of `tree-chart` will be added. If there are too many nodes, you can set `overflow: auto` to scroll through. | ||
| The parent element of the graph. After initialization, the class name of `tree-chart` will be added. If there are too many nodes, you can set `overflow: auto` to scroll through. | ||
@@ -466,3 +466,3 @@ ### contentRender | ||
| Re-render all the connecting lines in the chart | ||
| Re-render all the connecting lines in the graph | ||
| ```javascript | ||
@@ -476,3 +476,3 @@ chart.reloadLink() | ||
| Use the new data to render the entire chart, the format of `data` should be consistent with `option.data` | ||
| Use the new data to render the entire graph, the format of `data` should be consistent with `option.data` | ||
| ```javascript | ||
@@ -479,0 +479,0 @@ const data = { |
New alerts
License Policy Violation
LicenseThis package is not allowed per your license policy. Review the package's license to ensure compliance.
Found 1 instance in 1 package
Fixed alerts
License Policy Violation
LicenseThis package is not allowed per your license policy. Review the package's license to ensure compliance.
Found 1 instance in 1 package
Improved metrics
- Total package byte prevSize
- increased by0.01%
395025
No dependency changes