Product
Introducing License Enforcement in Socket
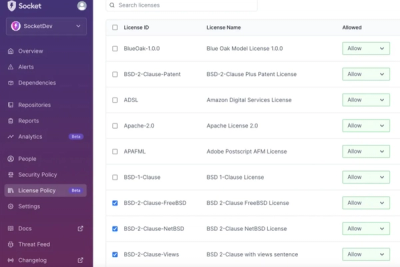
Ensure open-source compliance with Socket’s License Enforcement Beta. Set up your License Policy and secure your software!
By Philipp Burckhardt - Oct 17, 2024
A small (< 25 KB min), fast chart for time series, lines, areas, ohlc & bars (MIT Licensed)
μPlot is a fast, memory-efficient Canvas 2D-based chart for plotting time series, lines, areas, ohlc & bars; from a cold start it can create an interactive chart containing 150,000 data points in 135ms, scaling linearly at ~3,300 pts/ms. In addition to fast initial render, the zooming and cursor performance is by far the best of any similar charting lib; at < 25 KB, it's likely the smallest and fastest time series plotter that doesn't make use of context-limited WebGL shaders or WASM, both of which have much higher startup cost and code size.
However, if you're looking for true real-time 60fps performance with massive datasets, uPlot can only get you so far. WebGL should still be the tool of choice for applications like realtime signal or waveform visualizations: Try danchitnis/webgl-plot or huww98/TimeChart.

In order to stay lean, fast and focused the following features will not be added:
<canvas> elements to avoid continuous redraw and rescaling on each dragged pixel. If you have fewer than tens of thousands of datapoints, you can use uPlot's API to implement smooth zooming or panning. e.g. zoom-wheel, zoom-touch. Pagination of data also works well.The docs are a work in progress: https://github.com/leeoniya/uPlot/tree/master/docs
An outline of the API can be found in issue #48. For the time being, visit the ever-expanding collection of /demos which covers the vast majority of uPlot's config & API.
Benchmarks done on a ThinkPad T480S:

Full size: https://leeoniya.github.io/uPlot/demos/multi-bars.html
Raw data: https://github.com/leeoniya/uPlot/blob/master/bench/results.json
| lib            | size    | done    | js,rend,paint,sys | heap peak,final | interact (10s)      |
| -------------- | ------- | ------- | ----------------- | --------------- | ------------------- |
| uPlot          |   23 KB |   60 ms |   87   4   2   62 |  15 MB   7 MB   |  162  412  134  239 |
| Chart.js-next  |  244 KB |  195 ms |  276   3   3   83 |  32 MB  20 MB   | 3391   41   98 6380 |
| dygraphs       |  125 KB |  165 ms |  255   5   5  172 |  89 MB  46 MB   | 1992  268  307  361 |
| Flot           |  494 KB |  345 ms |  193   6   6  291 |  23 MB  11 MB   | ---                 |
| CanvasJS       |  448 KB |  314 ms |  398   5   4  103 |  35 MB  25 MB   | 2572 1007  346  470 |
| LightningChart |  883 KB |  --- ms |  411   4   3   72 |  37 MB  16 MB   | 9742   28   46   87 |
| jqChart        |  273 KB |  462 ms |  547   5   2   83 |  89 MB  52 MB   |  830  605  306  421 |
| Highcharts     |  285 KB |  --- ms |  698   7   2   62 |  48 MB  24 MB   | 1104  610  184  289 |
| Chart.js       |  239 KB |  671 ms |  695   4   3  172 |  94 MB  76 MB   | 5690    5   12 4221 |
| ECharts        |  734 KB |  --- ms |  734   5   8 1121 | 111 MB  76 MB   | 2286   57   53 7398 |
| ApexCharts     |  441 KB | 1194 ms | 2216  28  71   53 | 138 MB  94 MB   | 2106  232 7972   65 |
| ZingChart      |  691 KB | 2567 ms | 2694   7   1   49 | 140 MB 119 MB   | ---                 |
| amCharts       | 1100 KB | 5400 ms | 5860  49  13   90 | 235 MB 235 MB   | 4218 1634 3186  477 |
size includes the lib itself plus any dependencies required to render the benchmark, e.g. Moment, jQuery, etc.TODO (all of these use SVG, so performance should be similar to Highcharts):
FAQs
A small, fast chart for time series, lines, areas, ohlc & bars
The npm package uplot receives a total of 93,883 weekly downloads. As such, uplot popularity was classified as popular.
We found that uplot demonstrated a healthy version release cadence and project activity because the last version was released less than a year ago. It has 0 open source maintainers collaborating on the project.
Did you know?

Socket for GitHub automatically highlights issues in each pull request and monitors the health of all your open source dependencies. Discover the contents of your packages and block harmful activity before you install or update your dependencies.
Product
Ensure open-source compliance with Socket’s License Enforcement Beta. Set up your License Policy and secure your software!
Product
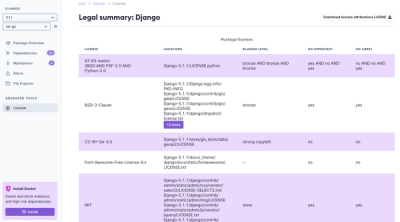
We're launching a new set of license analysis and compliance features for analyzing, managing, and complying with licenses across a range of supported languages and ecosystems.
Product
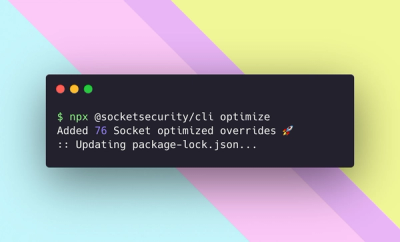
We're excited to introduce Socket Optimize, a powerful CLI command to secure open source dependencies with tested, optimized package overrides.