Product
Introducing License Enforcement in Socket
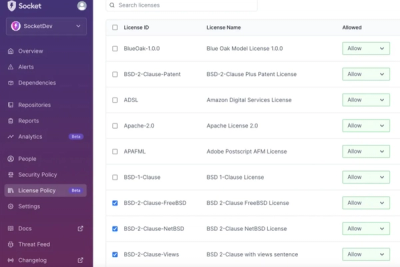
Ensure open-source compliance with Socket’s License Enforcement Beta. Set up your License Policy and secure your software!
By Philipp Burckhardt - Oct 17, 2024
A small (~30 KB min), fast chart for time series, lines, areas, ohlc & bars (MIT Licensed)
μPlot is a fast, memory-efficient Canvas 2D-based chart for plotting time series, lines, areas, ohlc & bars; from a cold start it can create an interactive chart containing 150,000 data points in 135ms, scaling linearly at ~25,000 pts/ms. In addition to fast initial render, the zooming and cursor performance is by far the best of any similar charting lib; at ~30 KB, it's likely the smallest and fastest time series plotter that doesn't make use of context-limited WebGL shaders or WASM, both of which have much higher startup cost and code size.
However, if you're looking for true real-time 60fps performance with massive datasets, uPlot can only get you so far. WebGL should still be the tool of choice for applications like realtime signal or waveform visualizations: Try danchitnis/webgl-plot, huww98/TimeChart, epezent/implot.

In order to stay lean, fast and focused the following features will not be added:
The docs are a perpetual work in progress, it seems. Start with /docs/README.md for a conceptual overview. The full API is further documented via comments in /dist/uPlot.d.ts. Additionally, an ever-expanding collection of runnable /demos covers the vast majority of uPlot's API.
Benchmarks done on a ThinkPad T480S:

Full size: https://leeoniya.github.io/uPlot/demos/multi-bars.html
Raw data: https://github.com/leeoniya/uPlot/blob/master/bench/results.json
| lib            | size    | done    | js,rend,paint,sys | heap peak,final | interact (10s)      |
| -------------- | ------- | ------- | ----------------- | --------------- | ------------------- |
| uPlot          |   28 KB |   65 ms |   99   5   1   67 |  15 MB   3 MB   |  198  371  129  237 |
| Chart.js-next  |  229 KB |  235 ms |  289   2   1   95 |  32 MB  20 MB   | 3604   34   46 6125 |
| LightningChart |  931 KB |  --- ms |  356   3   1   70 |  26 MB  20 MB   | 9114   65   55  272 |
| dygraphs       |  125 KB |  185 ms |  260   4   2  171 |  93 MB  48 MB   | 2294  241  114  404 |
| CanvasJS       |  479 KB |  323 ms |  378   5   1   93 |  40 MB  25 MB   | 2173  457  119  397 |
| Flot           |  494 KB |  334 ms |  202   7   2  283 |  24 MB  19 MB   | ---                 |
| dvxcharts      |  369 KB |  326 ms |  585  34   2   62 |  62 MB  26 MB   | 1394  717  204  270 |
| Highcharts     |  384 KB |  --- ms |  748   9   2   75 |  49 MB  21 MB   | 2012  725  217  317 |
| Chart.js       |  245 KB |  654 ms |  718   4   2  164 | 101 MB  85 MB   | 5550    5    7 4020 |
| Plotly.js      | 3400 KB |  465 ms |  828   7   1   83 |  50 MB  28 MB   | 1507  229   53  177 |
| ECharts        |  785 KB |  --- ms |  718   6   7 1120 | 116 MB  77 MB   | 2016   70   25 7856 |
| ApexCharts     |  460 KB |  --- ms | 2137  28   3   73 | 170 MB  97 MB   | 2030  220   28  122 |
| ZingChart      |  857 KB | 2535 ms | 2711   7   1   66 | 143 MB  85 MB   | ---                 |
| amCharts       | 1200 KB | 5825 ms | 7509  47  13   78 | 256 MB 256 MB   | 6932 1288  282  512 |
size includes the lib itself plus any dependencies required to render the benchmark, e.g. Moment, jQuery, etc.TODO (all of these use SVG, so performance should be similar to Highcharts):
FAQs
A small, fast chart for time series, lines, areas, ohlc & bars
The npm package uplot receives a total of 93,883 weekly downloads. As such, uplot popularity was classified as popular.
We found that uplot demonstrated a healthy version release cadence and project activity because the last version was released less than a year ago. It has 0 open source maintainers collaborating on the project.
Did you know?

Socket for GitHub automatically highlights issues in each pull request and monitors the health of all your open source dependencies. Discover the contents of your packages and block harmful activity before you install or update your dependencies.
Product
Ensure open-source compliance with Socket’s License Enforcement Beta. Set up your License Policy and secure your software!
Product
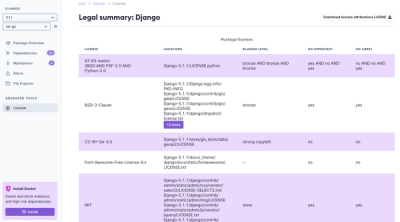
We're launching a new set of license analysis and compliance features for analyzing, managing, and complying with licenses across a range of supported languages and ecosystems.
Product
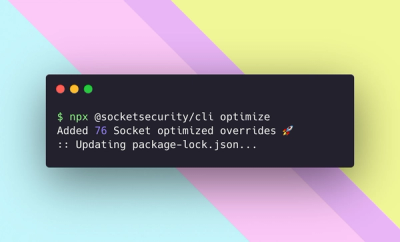
We're excited to introduce Socket Optimize, a powerful CLI command to secure open source dependencies with tested, optimized package overrides.