vtop
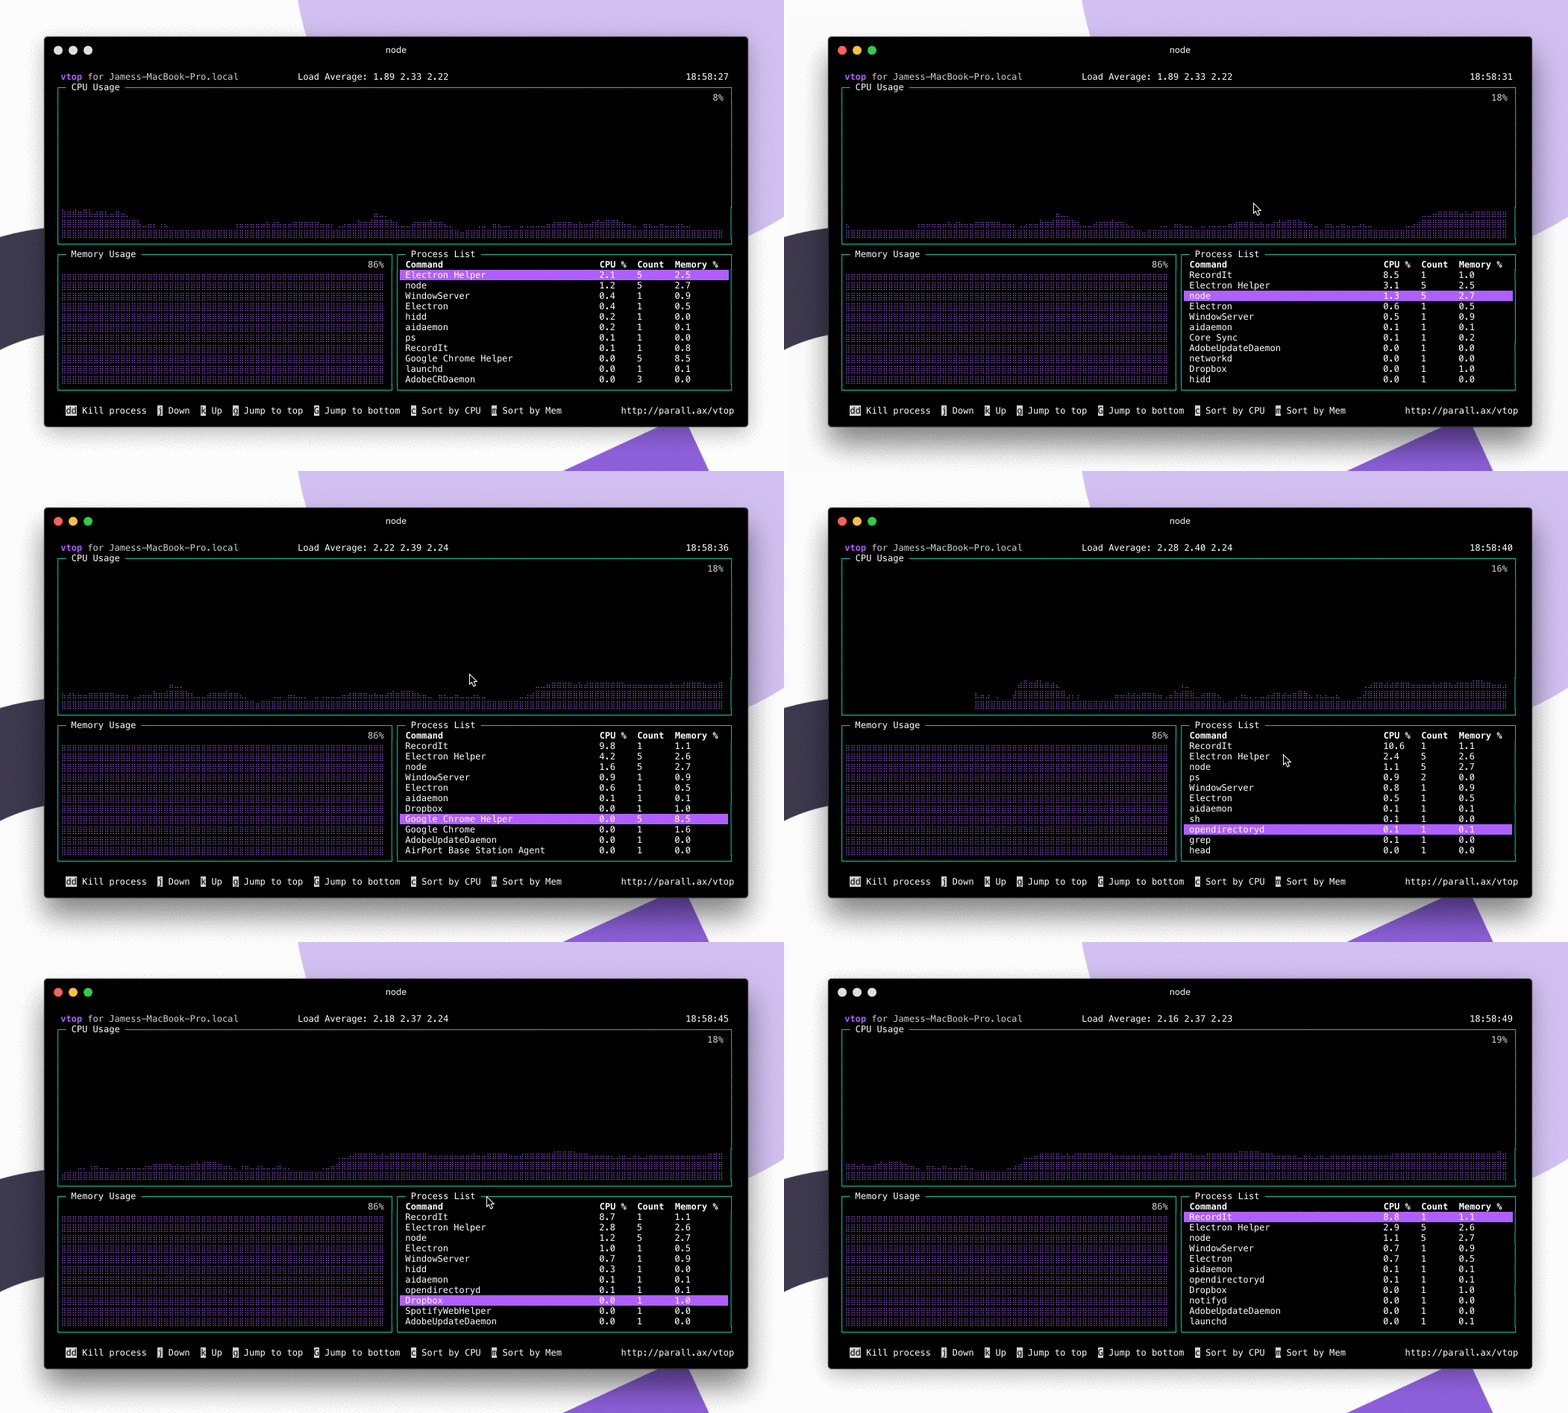
A graphical activity monitor for the command line. Written in node.js.

How to install
If you haven't already got Node.js, then go get it.
sudo npm install -g vtop
Running
This is pretty simple too.
vtop
If you really like vtop, but your finger muscle memory means you keep typing 'top' then why not add an alias to ~/.bashrc.
alias top="vtop"
alias oldtop="/usr/bin/top"
Keyboard shortcuts
- Press 'u' to update to the latest version of vtop.
- Arrow up or k to move up the process list.
- Arrow down or j to move down.
- g to go to the top of the process list.
- G to move to the end of the list.
- dd to kill all the processes in that group
Mouse control
If your terminal supports mouse events (like iTerm) then
you can click on the items in the process list. As well as
use the scroll wheel.
FAQs
How does it work?
It uses drawille to draw CPU and Memory charts with Unicode braille characters, helping you visualize spikes. We also group processes with the same name together.
I think the CPU % is coming out wrong.
We calculate the CPU percentage as a total of your overall system power. 100% is all cores and HyperThreads maxed out. This is different to how Apple Activity monitor works.
I think you should change CPU percentage to how Apple's Activity Monitor works.
No I like it this way. Feel free to submit a PR with it as a config option though.
Can I change the color scheme?
Sure, just do:
vtop --theme wizard
This loads the theme file in themes/ with the same name. Make your own and send me a Pull Request :)
You could add this to your aliases if you'd like to use it always.
alias vtop="vtop --theme brew"
What about measuring server req/s, log entries, etc etc?
Yeah that's on the list :) Feel free to send a pull request though. Check out the sensors/ folder.
What license is this under?
MIT – do what you like with it :)


