Research
Security News
Malicious npm Package Targets Solana Developers and Hijacks Funds
A malicious npm package targets Solana developers, rerouting funds in 2% of transactions to a hardcoded address.
Colormaps is a library of collection of colormaps or color palettes for Python. It's written in Python with matplotlib and numpy as dependencies. You can use Colormaps to customize matplotlib plots.
Colormaps has colormaps or color palettes from:
Python with:
pip install colormaps
or using conda
conda install colormaps -c conda-forge`
or using mamba
mamba install colormaps
or you can also use GitHub repo
git clone https://github.com/pratiman-91/colormaps.git
cd colormaps
python setup.py install
import colormaps as cmaps
cmaps.drought_severity

cmaps.ice

cmaps.ice.discrete(10)

cmaps.ice.shift(0.5)

cmaps.ice.shift(0.5).discrete(10)

cmaps.ice.discrete(11).cut(0.25, 'left')

from colormaps.utils import concat
concat1 = concat(["ice", "BkBlAqGrYeOrReViWh200"])

from colormaps.utils import concat
concat2 = concat([cmaps.ice, cmaps.BkBlAqGrYeOrReViWh200], ratios=[0.25,0.75])

import matplotlib.pyplot as plt
import colormaps as cmaps
import numpy as np

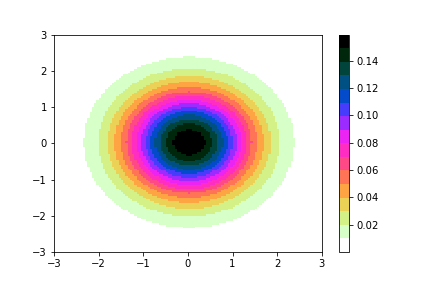
x = y = np.arange(-3.0, 3.01, 0.05)
X, Y = np.meshgrid(x, y)

sigmax = sigmay = 1.0
mux = muy = sigmaxy=0.0

Xmu = X-mux
Ymu = Y-muy

rho = sigmaxy/(sigmax*sigmay)
z = Xmu**2/sigmax**2 + Ymu**2/sigmay**2 - 2*rho*Xmu*Ymu/(sigmax*sigmay)
denom = 2*np.pi*sigmax*sigmay*np.sqrt(1-rho**2)
Z = np.exp(-z/(2*(1-rho**2))) / denom

plt.pcolormesh(X,Y,Z,cmap=cmaps.cubehelix3_16_r)
plt.colorbar()

Colormaps are pre-built and loaded at the time of importing.
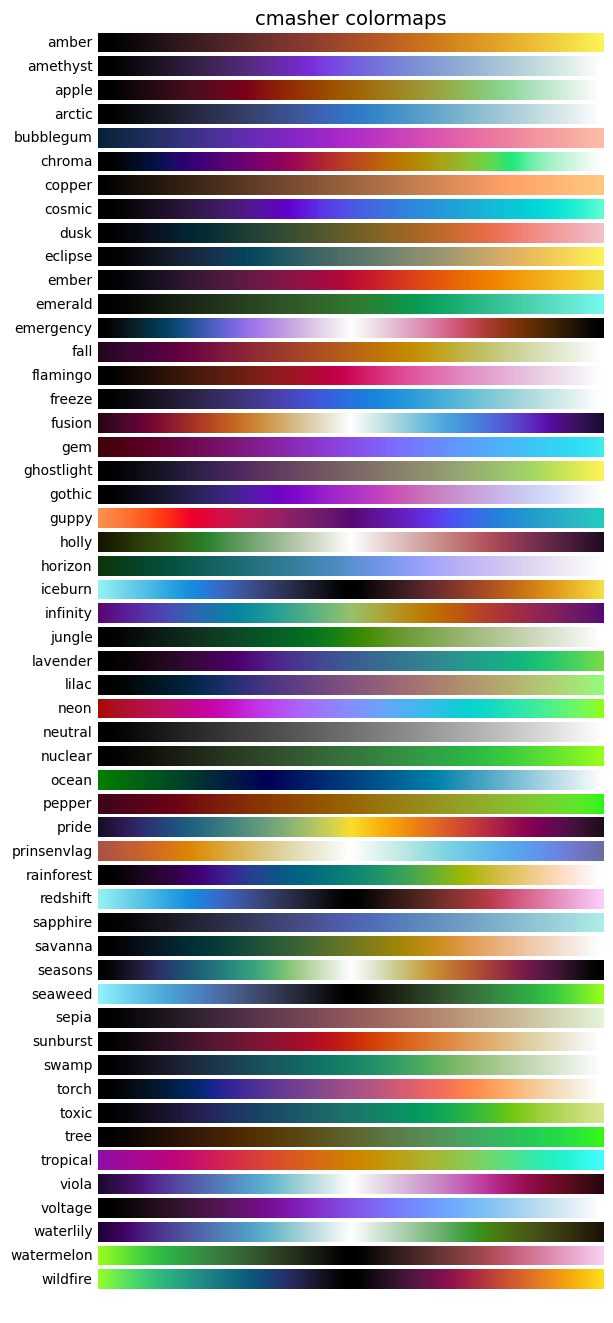
from colormaps.utils import show_cmaps_collection
show_cmaps_collection(collection='cmasher')

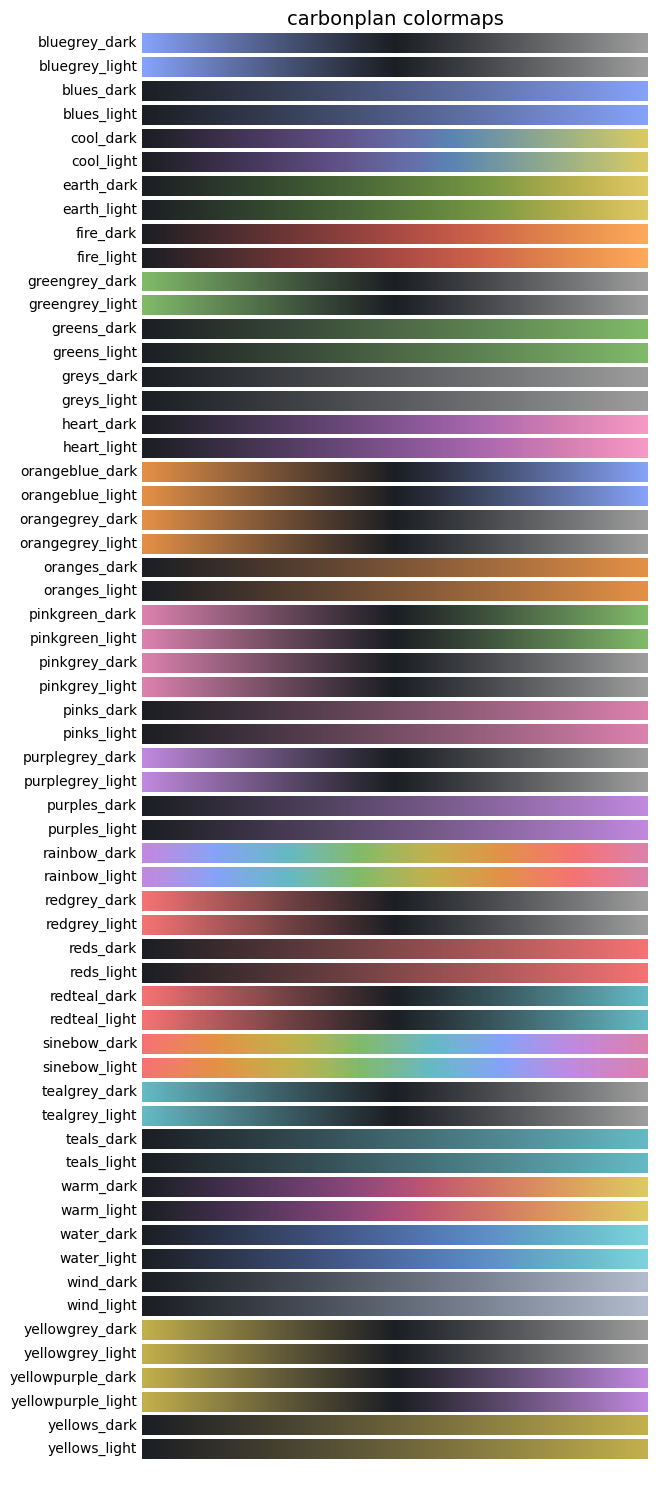
from colormaps.utils import show_cmaps_all
show_cmaps_all()
This is just a sample! You will get a long list of all possible colormap collections.

FAQs
Collection of colormaps or color palettes for Python
We found that colormaps demonstrated a healthy version release cadence and project activity because the last version was released less than a year ago. It has 1 open source maintainer collaborating on the project.
Did you know?

Socket for GitHub automatically highlights issues in each pull request and monitors the health of all your open source dependencies. Discover the contents of your packages and block harmful activity before you install or update your dependencies.

Research
Security News
A malicious npm package targets Solana developers, rerouting funds in 2% of transactions to a hardcoded address.

Security News
Research
Socket researchers have discovered malicious npm packages targeting crypto developers, stealing credentials and wallet data using spyware delivered through typosquats of popular cryptographic libraries.

Security News
Socket's package search now displays weekly downloads for npm packages, helping developers quickly assess popularity and make more informed decisions.