
Security News
Oracle Drags Its Feet in the JavaScript Trademark Dispute
Oracle seeks to dismiss fraud claims in the JavaScript trademark dispute, delaying the case and avoiding questions about its right to the name.
By Sarah Gooding - Feb 07, 2025
A simple, yet versatile, package for graphing equations on a 2-dimensional text canvas
Revision for 0.01
Glyth Graph is an open-source python package, for graphing equations onto a 2-dimensional array (named the canvas) with a variety of arguments to draw within a specific range and bound. Scaling to the width and height of the canvas in proportion
.Upon attaching the constructor to an object a 2D array with the declared resolution size will be filled with the chosen blank_glyth, named the canvas.
The package operates on mapping values between the x and f(x) from the graph equation to the given resolution of the canvas, translating coordinates with a non-uniform scaling factor to draw a glyth by a 2D index.

where rangefrom and rangeto are respectively the given x-axis region of the equation to draw.
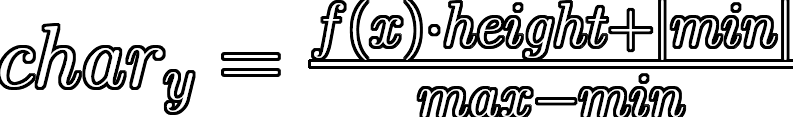
where max and min are respectively the calculated (or given) maximum and minimum y-axis values for the equation within the x-axis region.
The constructor of the class to create an attached object, setup the canvas array with the arguements given, both the size and blank (background) glyth
- resolution: the width by the height of the canvas measured in character glyths | 'x'.join([width, height])
- blank_glyth: the background glyth used for spacing the graph
Format the graph equation such that all unecessary characters are removed to be processed, this includes removal of 'y' and '=' if given an equation to form an expression and all ' ' (spaces) present

- equation: the mathematical equation of the graph going to be drawn
Calculate the upper and lower bounds in the y-axis of a graph equation between the given x-axis range, to be used later for mapping positions

- equation: the mathematical equation of the graph going to be drawn
- x_range: a tuple of the x-axis range between which the graph will be used, all outside this is unnecessary
Draw a glyth onto the canvas array dependent on given arguments in relation to the graph equation, including the x-axis range and y-axis bounds of the 2-dimensional section of the graph and character position along the canvas

- char_x: the x_axis glyth position of the canvas, such that it starts to the leftmost position (0) to the rightmost (canvas width - 1) | 0 <= char_x < canvas width
- equation: the mathematical equation of the graph going to be drawn
- glyth: the character/s to be drawn onto the canvas at the calculated coordinate relative to the graph equation
- x_range: a tuple of the x-axis range between which the graph will be used, all outside this is unnecessary | (range_from, range_to)
- y_bounds: a tuple of the y-axis bounds for the x-axis region of the graph, including both the minimum and maximum values | (min, max)
Clear the canvas by replacing all indicies in the array with the blank glyth assigned in the constructor, removing any graphs drawn
Pretty print the canvas array into equal rows of the set width with newline character moving to the next row, as each index is printed incrementally

- clear: a boolean value (either True or False) whether to clear the each canvas array index after printing the index | True or False
from glyth_graph import graph_basic
from random import choice

character_set = '0123456789ABCDEFGHIJKLMNOPQRSTUVWXYZabcdefghijklmnopqrstuvwxyz+/'

print('---Glyth Graph---')

print('\n---Resolution---')
width = int(input('Width (chars): '))
height = int(input('Height (chars): '))

glyth_graph = graph_basic(
    resolution = 'x'.join([str(width), str(height)]),
    blank_glyth = '  '
)

while True:
    print('\n---Graph Properties---')
    equation = glyth_graph.format_equation(input('Equation: '))
    range_from, range_to = int(input('x-axis From: ')), int(input('x-axis To: '))
    print()

    bounds = glyth_graph.y_bounds(
        equation = equation,
        x_range = (range_from, range_to)
    )

    for char_x in range(0, width):
        glyth_graph.draw_graph(
            char_x = char_x,
            equation = equation,
            glyth = choice(character_set),
            x_range = (range_from, range_to),
            y_bounds = bounds
        )

    glyth_graph.print_canvas()
An example of an output to the program, which can vary with custom values for all given inputs, pretty printing the canvas array:
---Glyth Graph---

---Resolution---
Width (chars): 100
Height (chars): 30

Width: 100 | Height: 30

---Graph Properties---
Equation: y = math.sin(x)
x-axis From: 0
x-axis To: 6.283185

                     LbvwLB+K
                  Rp8        49D
                MB              FgW
              Kt                   O
            i6                      +w
           t                          f
          z                            LZ
        k7                               q
       9                                  q
      Y                                    G
     3                                      yP
    r                                         c
   9                                           h
  C                                             4
 f                                               K
l                                                 M                                               oe
                                                   o                                             7
                                                    y                                           n
                                                     O                                         e
                                                      tf                                      0
                                                        M                                    u
                                                         r                                  O
                                                          I                               lv
                                                           o8                            w
                                                             L                          A
                                                              Q2                      uO
                                                                w                   LD
                                                                 zvu              8x
                                                                    nGl        xMw
                                                                       XsohPTDx
| Permissions | Conditions | Limitations |
|---|---|---|
| Commercial use | License and copyright notice | Liability |
| Distribution | Warranty | |
| Modification | ||
| Private use |
MIT License

Copyright (c) 2021 Ivan (GitHub: ivanl-exe, E-Mail: ivan.exe@pm.me)

Permission is hereby granted, free of charge, to any person obtaining a copy
of this software and associated documentation files (the "Software"), to deal
in the Software without restriction, including without limitation the rights
to use, copy, modify, merge, publish, distribute, sublicense, and/or sell
copies of the Software, and to permit persons to whom the Software is
furnished to do so, subject to the following conditions:

The above copyright notice and this permission notice shall be included in all
copies or substantial portions of the Software.

THE SOFTWARE IS PROVIDED "AS IS", WITHOUT WARRANTY OF ANY KIND, EXPRESS OR
IMPLIED, INCLUDING BUT NOT LIMITED TO THE WARRANTIES OF MERCHANTABILITY,
FITNESS FOR A PARTICULAR PURPOSE AND NONINFRINGEMENT. IN NO EVENT SHALL THE
AUTHORS OR COPYRIGHT HOLDERS BE LIABLE FOR ANY CLAIM, DAMAGES OR OTHER
LIABILITY, WHETHER IN AN ACTION OF CONTRACT, TORT OR OTHERWISE, ARISING FROM,
OUT OF OR IN CONNECTION WITH THE SOFTWARE OR THE USE OR OTHER DEALINGS IN THE
SOFTWARE.
FAQs
A simple, yet versatile, package for graphing equations on a 2-dimensional text canvas
We found that glyth-graph demonstrated a healthy version release cadence and project activity because the last version was released less than a year ago. It has 1 open source maintainer collaborating on the project.
Did you know?

Socket for GitHub automatically highlights issues in each pull request and monitors the health of all your open source dependencies. Discover the contents of your packages and block harmful activity before you install or update your dependencies.
Security News
Oracle seeks to dismiss fraud claims in the JavaScript trademark dispute, delaying the case and avoiding questions about its right to the name.

Security News
The Linux Foundation is warning open source developers that compliance with global sanctions is mandatory, highlighting legal risks and restrictions on contributions.

Security News
Maven Central now validates Sigstore signatures, making it easier for developers to verify the provenance of Java packages.