
Security News
Oracle Drags Its Feet in the JavaScript Trademark Dispute
Oracle seeks to dismiss fraud claims in the JavaScript trademark dispute, delaying the case and avoiding questions about its right to the name.
By Sarah Gooding - Feb 07, 2025
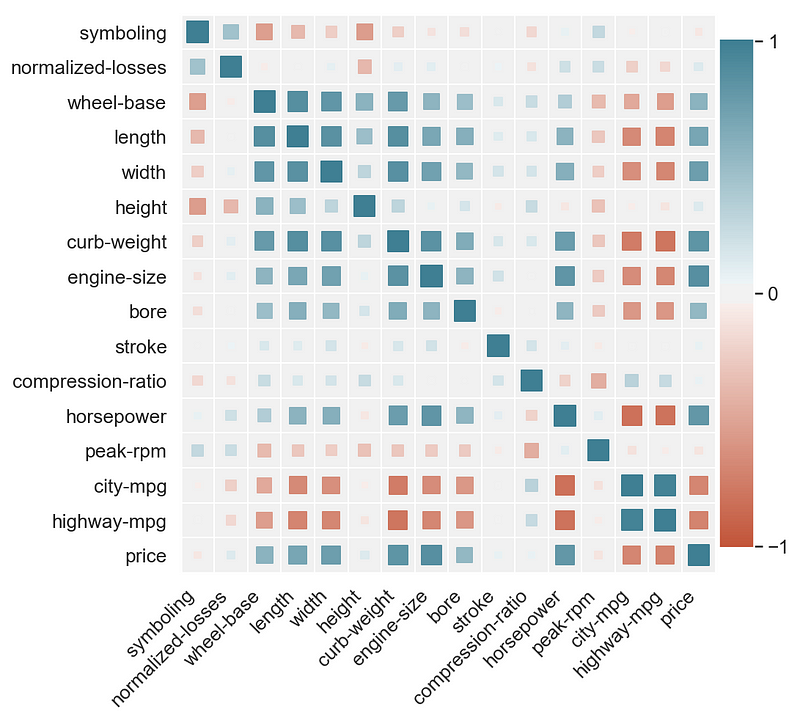
Python code and Jupyter notebook for an improved heatmap implementation using Matplotlib and Seaborn.
Similar to what you can easily get in Tableau using a Size parameter, here you can have square size as parameter depending on the field value.
Described in detail in this blog post: https://towardsdatascience.com/better-heatmaps-and-correlation-matrix-plots-in-python-41445d0f2bec
See below for installation details, reference and examples.

To get the pip package run:
pip install heatmapz
Then you can use the following imports:
from heatmap import heatmap, corrplot
heatmap(x, y, **kwargs)Parameters:
x : A list, np.array or pandas.Series containing the values for the horizontal dimension
y : A list, np.array or pandas.Series containing the values for the vertical dimension
Optional parameters:
color : A list, np.array or pandas.Series containing values based on which to apply the heatmap color. Should have the same length as x and y.
palette : A list of colors to use as the heatmap palette. The values from color are mapped onto the palette so that min(color) -> palette[0] and max(color) -> palette[len(palette)-1], and the values in between are linearly interpolated. A good way to choose or create a palette is to simply use Seaborn palettes (https://seaborn.pydata.org/tutorial/color_palettes.html).
color_range : A tuple (color_min, color_max) that enables capping the values of color being mapped to palette. All color values less than color_min are capped to color_min, and all color values larger than color_max are capped to color_max. Then those values are mapped to palette as described under color.
size : A list, np.array or pandas.Series containing values based on which to apply the size to the shapes in the plot. Should have the same length as x and y.
size_range : A tuple (size_min, size_max) that enables capping the values of size being applied to the shapes in the plot. Essentially controls min and max size of the shapes.
size_scale : Used to scale the size of the shapes in the plot to make them fit the size of the fields in the matrix. Default value is 500. You will likely need to fiddle with this parameter in order to find the right value for your figure size and the size range applied.
x_order : Should contain all distinct values of x ordered in the way you want them shown on the x-axis from left to right.
y_order : Should contain all distinct values of y ordered in the way you want them shown on the y-axis from bottom to top.
marker : Specify the shape to use in the plot. It can be any of the matplotlib marker shapes (https://matplotlib.org/api/markers_api.html). The default is 's' for square.
xlabel : Label for the x-axis. Default is none.
ylabel : Label for the y-axis. Default is none.
corrplot(data, size_scale=500, marker='s')A shorthand function for making correlation plots from pandas dataframes.
Parameters:
data : You should pass the result of calling df.corr() on a dataframe.
size_scale : Used to scale the size of the shapes in the plot to make them fit the size of the fields in the matrix. Default value is 500. You will likely need to fiddle with this parameter in order to find the right value for your figure size and the size range applied.
marker : Specify the shape to use in the plot. It can be any of the matplotlib marker shapes (https://matplotlib.org/api/markers_api.html). The default is 's' for square.
You can find a walktrough with examples in this Colab notebook https://colab.research.google.com/drive/1YSvER-U3cwGplSHyXwaCXYhOWfWO53Iy
FAQs
Create heatmaps with shapes and size as a parameter
We found that heatmapz demonstrated a healthy version release cadence and project activity because the last version was released less than a year ago. It has 1 open source maintainer collaborating on the project.
Did you know?

Socket for GitHub automatically highlights issues in each pull request and monitors the health of all your open source dependencies. Discover the contents of your packages and block harmful activity before you install or update your dependencies.
Security News
Oracle seeks to dismiss fraud claims in the JavaScript trademark dispute, delaying the case and avoiding questions about its right to the name.

Security News
The Linux Foundation is warning open source developers that compliance with global sanctions is mandatory, highlighting legal risks and restrictions on contributions.

Security News
Maven Central now validates Sigstore signatures, making it easier for developers to verify the provenance of Java packages.