Security News
Fluent Assertions Faces Backlash After Abandoning Open Source Licensing
Fluent Assertions is facing backlash after dropping the Apache license for a commercial model, leaving users blindsided and questioning contributor rights.

A small library for creating pretty heatmaps of daily data.
July does not rely only pandas (though it accepts it). Only numpy arrays and native Python data structures are used internally.datetime.datetime, datetime.date, str, pd.DatetimeIndex$ pip install july
import numpy as np
import matplotlib.pyplot as plt
import july
from july.utils import date_range

dates = date_range("2020-01-01", "2020-12-31")
data = np.random.randint(0, 14, len(dates))
# GitHub Activity like plot (for someone with consistently random work patterns).
july.heatmap(dates, data, title='Github Activity', cmap="github")

# Here, 'osl_df' is a pandas df.
july.heatmap(osl_df.date, osl_df.temp, cmap="golden", colorbar=True, title="Average temperatures: Oslo , Norway")

# More exhaustive example using useless, but pretty colours.
july.heatmap(dates=dates,
             data=data,
             cmap='Pastel1',
             month_grid=True,
             horizontal=True,
             value_label=False,
             date_label=False,
             weekday_label=True,
             month_label=True,
             year_label=True,
             colorbar=False,
             fontfamily="monospace",
             fontsize=12,
             title=None,
             titlesize='large',
             dpi=100)

# Month plot with dates.
july.month_plot(dates, data, month=5, date_label=True, ax=axes[0])
# Month plot with values.
july.month_plot(dates, data, month=5, value_label=True, ax=axes[1])

# Calendar plot.
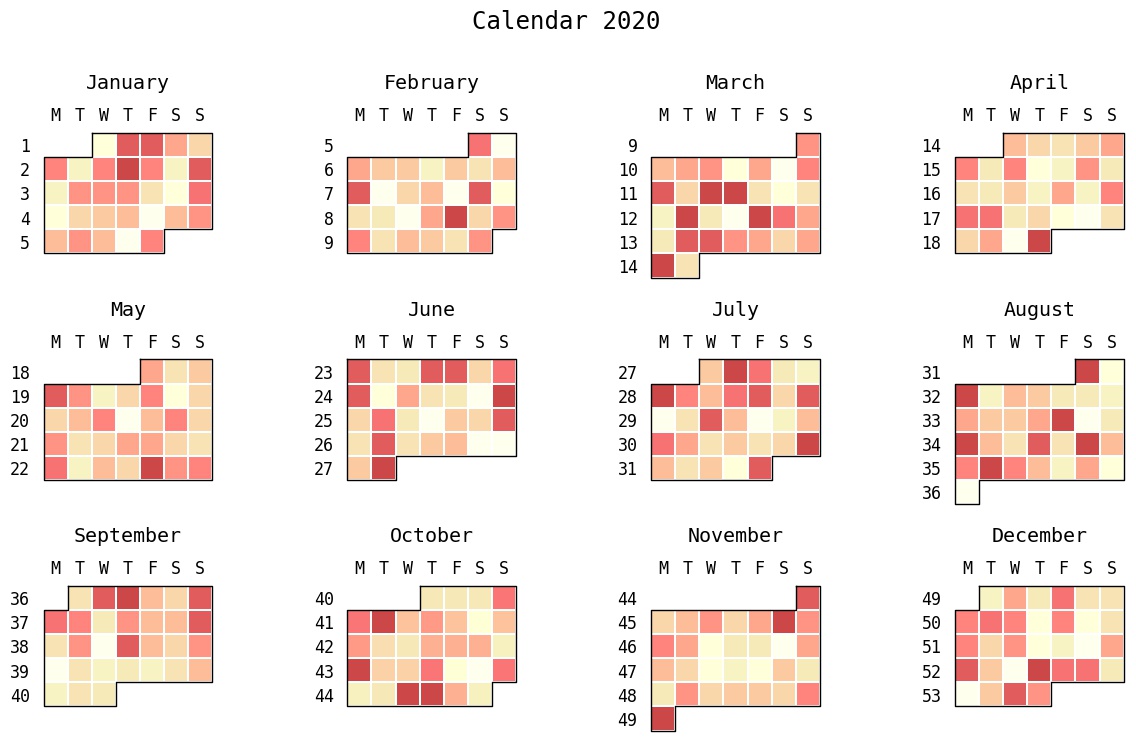
july.calendar_plot(dates, data)

Main reason: All the obvious names like calplot, calmap, and calendarplot were all already taken by similar packages. This had me looking for a new name that wouldn't get easily mixed up with the other packages.
The reasoning was roughly as follows:
Heatmap + month → Hot month → July :sparkles:Also, as a summer loving person stuck in the Northern hemisphere, July is my favourite month by a light year.
v0.1.0: Working build but with minimal documentation.v0.1.1: Fix relative image link in readme.v0.1.2: Remove unnecessary argument from rcmod to be compatible with matplotlib versions earlier than v3.4.x.v0.1.3: Fix week number labelling bug in month_plot() and calendar_plot()date_grid and colorbar are used in conjunction.YYYY-MM-DD.FAQs
A small library for creating pretty heatmaps of daily data.
We found that july demonstrated a healthy version release cadence and project activity because the last version was released less than a year ago. It has 1 open source maintainer collaborating on the project.
Did you know?

Socket for GitHub automatically highlights issues in each pull request and monitors the health of all your open source dependencies. Discover the contents of your packages and block harmful activity before you install or update your dependencies.

Security News
Fluent Assertions is facing backlash after dropping the Apache license for a commercial model, leaving users blindsided and questioning contributor rights.

Research
Security News
Socket researchers uncover the risks of a malicious Python package targeting Discord developers.

Security News
The UK is proposing a bold ban on ransomware payments by public entities to disrupt cybercrime, protect critical services, and lead global cybersecurity efforts.