
Product
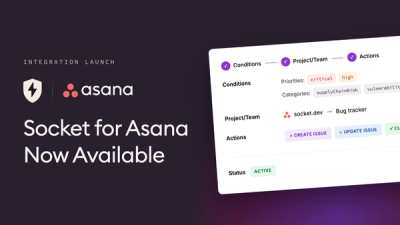
Socket for Asana Is Now Available
Create and manage Asana tasks directly from Socket alerts, with manual task creation, automated ticketing rules, and two-way sync.
By Jeppe Hasseriis - Aug 25, 2026
oid-mcp
Advanced tools
MCP server that gives AI agents eyes on OpenImageDebugger buffers in a
live gdb/lldb session: list observable symbols at a breakpoint, view
renderings, read exact values, dump lossless .npy copies, and mirror
buffers into the human viewer.
⚠️ Experimental. This is a new, experimental feature — the control protocol, tool surface, and behavior may change without notice, and it is not yet covered by any stability guarantee. It is opt-in (
OID_AGENT=1) and exposes debuggee memory to local processes; enable it only in trusted, local development. Feedback welcome.
Two cooperating pieces, connected over a localhost socket:
oid.py, stdlib-only)
starts inside your debugger's embedded Python when OID_AGENT=1 is
set. It writes a per-session discovery file (host, port, random
token) into a private per-user directory.oid-mcp server (this package) is launched by your MCP
client, reads the discovery file, connects with the token, and does
the heavy lifting (decode, PNG rendering, stats, .npy) outside the
fragile debugger process.You run the debugger; the MCP client runs oid-mcp. They find each
other through the discovery directory, so both must be able to read
the same directory (see Troubleshooting).
oid.py.
See the top-level README's Building the Open Image
Debugger.lldb — the same debugger you already use with OID.pip install needed. Install with
curl -LsSf https://astral.sh/uv/install.sh | sh (or brew install uv).Verify the server launches (optional but recommended). From a shell:
uv run --directory /path/to/OpenImageDebugger/resources/oidmcp oid-mcp
The first run resolves mcp/numpy/pillow into a local venv. It
prints an experimental/security warning to stderr and then waits for
MCP traffic on stdin — that blocking wait means it started
correctly. Press Ctrl-C to exit.
Register it with your MCP client. Every stdio MCP client uses the
same mcpServers schema — only the file location differs. Each client
spawns its own oid-mcp process, so you can register it in several
clients at once; they all discover the same debug session.
Claude Code — one-liner:
claude mcp add oid -- \
  uv run --directory /path/to/OpenImageDebugger/resources/oidmcp oid-mcp
or add it to .mcp.json:
{
  "mcpServers": {
    "oid": {
      "command": "uv",
      "args": ["run", "--directory",
               "/path/to/OpenImageDebugger/resources/oidmcp",
               "oid-mcp"]
    }
  }
}
Cursor — put the same entry in ~/.cursor/mcp.json (global, all
projects) or <workspace>/.cursor/mcp.json (one project). Settings →
MCP / Tools & Integrations → Add new MCP server opens that file.
The tools are only usable from Cursor's Agent chat.
{
  "mcpServers": {
    "oid": {
      "command": "/absolute/path/to/uv",
      "args": ["run", "--directory",
               "/path/to/OpenImageDebugger/resources/oidmcp",
               "oid-mcp"]
    }
  }
}
Use an absolute
commandpath in desktop editors. Cursor and other GUI IDEs do not inherit your shellPATH, so a bare"uv"often fails to launch. Use the output ofcommand -v uv(e.g./opt/homebrew/bin/uvwith Apple-Silicon Homebrew). The same goes for any interpreter the client can't resolve on its own.
Optional environment variables (set them on the server entry via
your client's env field, and — for OID_AGENT_DIR — on the
debugger too):
| Variable | Default | Purpose |
|---|---|---|
OID_MCP_MAX_BYTES | 268435456 (256 MiB) | Reject buffers larger than this before transfer |
OID_AGENT_DIR | ~/.oid-agent/ (%LOCALAPPDATA%\oid-agent on Windows) | Discovery directory shared by debugger and server |
Discovery location. The default directory is derived from your home directory (via the password database), so a GUI-spawned
oid-mcpand a terminal debugger resolve the same path regardless of$TMPDIR/$HOME. To relocate it, setOID_AGENT_DIRin both environments to the same absolute path (~is not expanded).
Start the debugger with the endpoint enabled and OID loaded:
OID_AGENT=1 gdb ./your-program
(gdb) source /path/to/OpenImageDebugger/oid.py
lldb works the same way:
OID_AGENT=1 lldb ./your-program
(lldb) command script import /path/to/OpenImageDebugger/oid.py
(If oid.py is already in your ~/.gdbinit / ~/.lldbinit, just
launch the debugger with OID_AGENT=1 in its environment.)
Run to a breakpoint. The endpoint activates and publishes its
discovery file on the first stop. The OID viewer window also opens
as usual — plot needs it, the other tools do not.
Drive it from the agent. A typical flow:
list_sessions()                       # confirm the server sees your debugger
list_buffers()                        # what's observable at this stop
view("frame")                         # look at the whole buffer
view("frame", region=[100,100,64,64]) # zoom into a suspicious spot
stats("frame")                        # min/max/mean/std, NaN/Inf/zero counts
values("frame", x=100, y=100, w=4, h=4)  # exact numbers for a tiny crop
dump("frame")                         # lossless .npy for offline analysis
plot("frame")                         # mirror it into the human's viewer
Every tool accepts session=<pid> to target a specific debugger
when more than one is live; it defaults to the most recently started
session.
The pixel tools (view, stats, values, dump, list_buffers) don't
require a debugger at all. A viewer started standalone with the agent
endpoint enabled:
OID_AGENT=1 oidwindow --open path/to/image.png
exposes the same endpoint even with no debugger attached, so an agent can inspect whatever a user currently has open in the viewer.
When a debugger did spawn the viewer, that viewer's session carries a
debugger_pid back-pointer, so set_view/get_view accept either the
viewer's own pid or its debugger's pid to address that window. (The
pixel tools — view/stats/values/dump/list_buffers — prefer the
debugger's own buffers when given a debugger pid, and fall back to the
viewer only when there's no live debugger session.) list_sessions()
reports the pairing (see below).
set_view/get_view always target a viewer (there's nothing to move
in a debugger without one), resolved the same way: a viewer pid, or a
debugger pid paired to a live viewer.
| Tool | Purpose |
|---|---|
list_sessions() | {"debuggers": [...], "viewers": [...]} — live debug sessions and viewer windows (all tools take session=<pid>); each viewer entry shows its debugger_pid pairing (null for a standalone viewer) |
list_buffers() | Observable buffer symbols at the current stop (debugger or viewer session) |
view(symbol, region?, channel?, vmin?, vmax?, max_px?) | PNG rendering; region is the stateless zoom |
stats(symbol, region?) | Per-channel min/max/mean/std, NaN/Inf/zero counts |
values(symbol, x, y, w, h, channel?) | Exact numbers (≤1024 per call) |
dump(symbol, path?, overwrite?) | Lossless .npy dump into the per-user dump directory; path is a filename within it (not an arbitrary path); refuses to overwrite an existing file unless overwrite=true |
plot(symbol) | Mirror into the human viewer window |
set_view(session?, buffer?, center?, zoom?, rotation_deg?, channel?, auto_contrast?) | Set the viewer's view absolutely (idempotent — it sets state, it does not nudge); omitted fields keep their current value; channel is 0, 1, 2, or "all"; auto_contrast is a global viewer toggle, not per-buffer |
get_view(session?) | Read the viewer's current buffer/center/zoom/rotation_deg/channel/auto_contrast |
OID_AGENT=1 is set; it binds
localhost with a per-session token (discovery files under
~/.oid-agent/, override with OID_AGENT_DIR). It
exposes debuggee memory to local processes that can read those
files — the same trust domain as your user account.OID_MCP_MAX_BYTES (default 256 MiB).plot requires it, the other tools do not.no live OID debug session found — the server can't see a
session. Check, in order: OID_AGENT=1 was set in the debugger's
environment; oid.py was actually sourced/imported; the debuggee has
stopped at a breakpoint at least once; and the debugger and oid-mcp
agree on the discovery directory. If they run under different
TMPDIR values (common on macOS, where each process may get its own
per-user temp dir), set OID_AGENT_DIR to the same absolute path on
both sides.Refusing to read OID discovery files from … (stderr) — the
discovery directory is a symlink, is not owned by you, or is
group/world-accessible, so a token there can't be trusted. Point
OID_AGENT_DIR at a private directory you own with mode 0700.The debuggee is running — pause at (or step to) a breakpoint;
symbols can only be evaluated while stopped, then retry.Buffer exceeds the transfer cap — raise OID_MCP_MAX_BYTES
(bytes) on the server entry, or narrow what you fetch.FAQs
MCP server giving AI agents eyes on OpenImageDebugger buffers in live gdb/lldb sessions
We found that oid-mcp demonstrated a healthy version release cadence and project activity because the last version was released less than a year ago. It has 1 open source maintainer collaborating on the project.
Product
Create and manage Asana tasks directly from Socket alerts, with manual task creation, automated ticketing rules, and two-way sync.

Security News
Open VSX has removed three extension IDs from its malicious-extension list as the legitimate publishers they impersonated move to claim the names for themselves.

Product
Socket’s PHP and Composer support is now in Beta for all customers, with PHP reachability analysis generally available.