pheatmap

pheatmap for Python.
You can create a heatmap with its annotation bars, just like pheatmap of R. Documnets at here
Requirements
pheatmap need python > 3.8, and numpy, pandas and matplolib.
Install
You can install pheatmap by pip.
pip install pheatmap
Run the command above, pip will automatically install numpy, pandas and matplolib.
Usage
import numpy as np
import pandas as pd
from pheatmap import pheatmap

nrows, ncols = 10, 10
mat = np.linspace(-1, 1, nrows * ncols).reshape(nrows, ncols)
rownames = ["abcdefghig"[i % 10] for i in np.arange(nrows)]
colnames = ["xyz"[i % 3] for i in np.arange(ncols)]

mat = pd.DataFrame(mat, index=rownames, columns=colnames)

anno_row = pd.DataFrame(dict(
    anno1=np.linspace(0, 10, nrows),
    anno2=["CNS"[i % 3] for i in np.arange(nrows)]
))
anno_col = pd.DataFrame(dict(
    anno3=np.linspace(0, 20, ncols),
    anno4=["ABC"[i % 3] for i in np.arange(ncols)]
))

anno_row_cmaps = {"anno1": "Blues", "anno2": "Set1"}
anno_col_cmaps = {"anno3": "Purples", "anno4": "Set3"}

fig = pheatmap(
    self.mat, annotation_row=self.anno_row, annotation_col=self.anno_col,
    annotation_row_cmaps=self.anno_row_cmaps, annotation_col_cmaps=self.anno_col_cmaps
)
fig.savefig("tests/pheatmap.png")
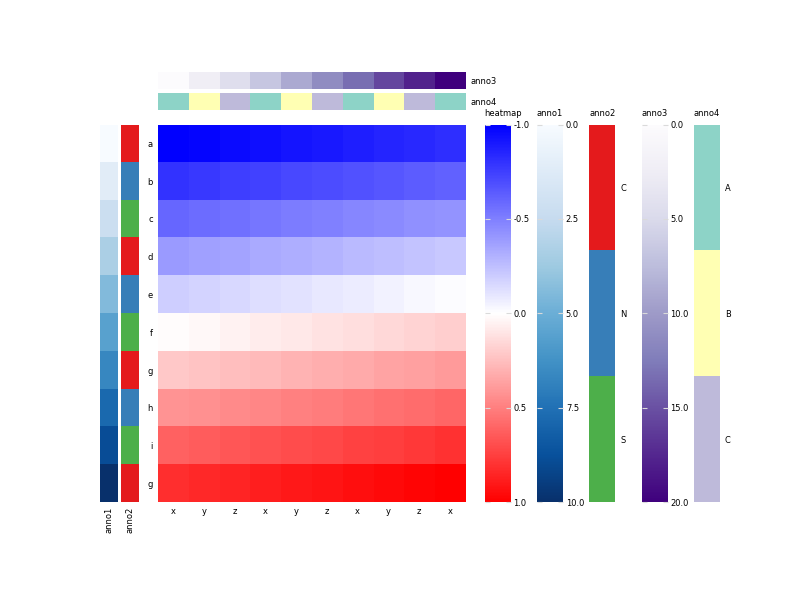
Run the above code at the ipython or jupyter notebook. You can see the fellow heatmap with its
annotation bars.
Also, you can save the figure to file. For example, save the figure to PDF file.
fig.savefig("pheatmap.pdf")