pydatatable v1.2
Python Library to create graphical table from the data and is with auto update feature!
pydatatable is a Python library made to display graphical tables from the given data.


Introduction
pydatatable is a Python library made to display graphical tables from given data. It can create a graphical table
in the form of a '.html' file. This library is made by Siddhesh Chavan(me). The table can even self update itself if you
enable it.
Installation
To install the library type: pip insall pydatatable in the command prompt.
Import Statement
Type import pydatatable to import it after installation.
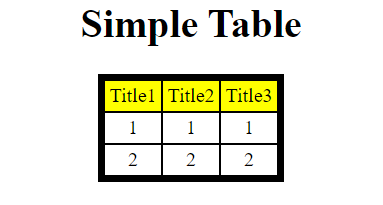
Creating a Simple Table
To create a simple table, type:
import pydatatable as table
table1 = table.Table(location='table_test', title='Simple Table')
all_data = [[1, 1, 1], [2, 2, 2]]
title = ['Title1', 'Title2', 'Title3']
table1.add_data(data=all_data, columns=title)
table1.open()
The above program will save a '.html' file in the given location. It will open a '.html' document as shown below:
The Table Class
The Table class contains many features:
Parameters:
The Table class's parameters:
location --> The path to save the table.title --> The title of the table.table_border --> The boder of the table in integer format.border_color --> The boder colour of the table in string format like 'red', 'black', 'green', etc. and you can
also use hexadecimal values as '#ff0000'cell_padding --> The space between the individual cell contents and the cell border. Use the value in integer
format.cell_spacing -> The space between the cell border and the table border. Use the value in integer format.cell_horizontal_text_align --> The horizontal text align of the text in each cell. Use values like 'center', '
left', 'right'.cell_vertical_text_align --> The vertical text align of the text in each cell. Use values like 'middle', '
top', 'bottom'.column_bg_color --> The background colour of the columns in the table. Use any color or the hexadecimal value in
string format.data_bg_color --> The background colour of the data in the table. Use any color or the hexadecimal value in
string format.column_text_color --> The text colour of the text in columns.data_text_color --> The text colour of the text in the data rows.print_log --> Set it to True if you want the table making log to be printed out on the console.font --> The font of the table.
Use above parameters like:
import pydatatable as table
table1 = table.Table(location='test_table', title='Table', table_border=5, border_color='Black', cell_padding=3,
cell_spacing=0,
cell_horizontal_text_align='center', cell_vertical_text_align='middle', column_bg_color='Yellow',
data_bg_color='White', column_text_color='Black', data_text_color='Black',
print_log=False)
all_data = [[1, 1, 1], [2, 2, 2]]
title = ['Title1', 'Title2', 'Title3']
table1.add_data(data=all_data, columns=title)
table1.open()
Functions:
1. add_data(data, columns)
Function to add the data to the table.
- The
data should have a nested list with all the data. For example, data=[[1,1,1],[2,2,2]] - The
columns should have a list of all columns to be showed in the table. For
example, columns=['Title1','Title2','Title3']
The length of the nested list, data, should be equal to the data in the columns as shown in the above example.
2. enable_auto_update(time=5000)
Function to enable auto update the table.
- The
time should be in milliseconds and integer format. It is the time after which the table is updated.
3.disable_auto_update()
Function to disable auto update.
4.update_data(data, append=False, wait=True)
Function to update the data. Remember to call this function in a loop
- The
data is the nested list of the data to be updated. - If you want to append the new data to the previous data then set append to
True else False - If you want your program to wait for the given auto update time and run again then the set
wait to True,
if not then False
For Example,
import pydatatable as table
import random

table1 = table.Table('table')
table1.add_data([[0, 0, 0]], ['1', '2', '3'])
table1.enable_auto_update()
table1.open()

i = 3
while True:
    one = random.randint(0, 99999)
    two = random.randint(0, 99999)
    three = random.randint(0, 99999)
    table1.update_data(data=[[one, two, three]], append=True, wait=True)
    i += 1
The above program will create and update the table by random values. Make sure to call the 'enable_auto_update()'
function before the 'open()' function.
5.open()
Function to open the saved table automatically.
6.print_settings()
Function to print the table's settings in the console.
Creating Multiple Tables on one page
To create multiple tables on one page, use the MultipleTables class. For Example,
import pydatatable as table
import random
import time

table1 = table.Table('table')
table1.add_data([[0, 0, 0]], ['1', '2', '3'])
table1.enable_auto_update()

table2 = table.Table('table2')
table2.add_data([[0, 0, 0]], ['1', '2', '3'])
table2.enable_auto_update()

multiple_table = table.MultipleTables('chart', 'All Types', height=600, width=700)
multiple_table.add_table(['table.html', 'table2.html'])
multiple_table.open()

i = 3
while True:
    one = random.randint(0, 99999)
    two = random.randint(0, 99999)
    three = random.randint(0, 99999)
    table1.update_data(data=[[one, two, three]], append=True, wait=False)
    table2.update_data(data=[[one, two, three]], append=True, wait=False)
    time.sleep(5)
    i += 1
Use wait=False if you want to update both the tables at the same time but also use time.sleep() function
otherwise the table will not be displayed. Check the above program. The above output is:

The MultipleTables Class
The MultipleTables class contains many features:
Parameters:
location --> The location of the '.html' page to be saved.title --> The title of group of tables.height --> The height of all frames.width --> The width of all frames.frame_border --> The frame border of all frames.border --> The border width of all frames.border_color --> The border color of all frames.
Functions:
1. add_table(table_locations, frame_value=[], frame_size=[])
Function to add the saved tables on one page.
table_locations --> The list of all the line's saved locations to be added on one page. The elements should be
separated by commas and should be in 'string' format. Please give the correct location along with the extension. The
order of charts in the page is same as the order of files given in the list. You can change the values in the list to
add the charts accordingly.frame_value --> If you want to change the size of one table in a page then give the table's list index according
to the 'table_locations' list and use the frame_size parameter to set a different size for that specified table.frame_size --> If you pass the 'frame_size' parameter, then give the size of that table in a 2-d list. First is
height and then width.
2. open()
Function to open the saved multiple charts.
3. print_settings()
Function to print the table settings.
Thank you for installing this module!


