Product
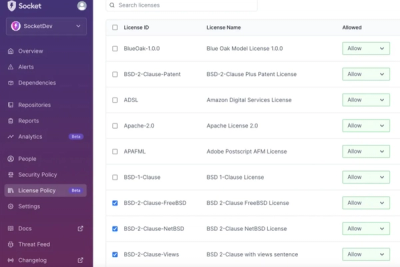
Introducing License Enforcement in Socket
Ensure open-source compliance with Socket’s License Enforcement Beta. Set up your License Policy and secure your software!
By Philipp Burckhardt - Oct 17, 2024
tableone is a package for creating 'Table 1' summary statistics for a patient population.
tableone is a package for creating "Table 1" summary statistics for a patient population. It was inspired by the R package of the same name by Yoshida and Bohn.
![]()

![]()
If you use tableone in your study, please cite the following paper:
Tom J Pollard, Alistair E W Johnson, Jesse D Raffa, Roger G Mark; tableone: An open source Python package for producing summary statistics for research papers, JAMIA Open, https://doi.org/10.1093/jamiaopen/ooy012
For documentation, see: http://tableone.readthedocs.io/en/latest/. An executable demonstration of the package is available on GitHub as a Jupyter Notebook. The easiest way to try out this notebook is to open it in Google Colaboratory. A paper describing our motivations for creating the package is available at: https://doi.org/10.1093/jamiaopen/ooy012.
tableoneWhile we have tried to use best practices in creating this package, automation of even basic statistical tasks can be unsound if done without supervision. We encourage use of tableone alongside other methods of descriptive statistics and, in particular, visualization to ensure appropriate data handling.
It is beyond the scope of our documentation to provide detailed guidance on summary statistics, but as a primer we provide some considerations for choosing parameters when creating a summary table at: http://tableone.readthedocs.io/en/latest/bestpractice.html.
Guidance should be sought from a statistician when using tableone for a research study, especially prior to submitting the study for publication.
At a high level, you can use the package as follows:


Additional options include:
categorical, numerical, nonnormal).To install the package with pip, run:
pip install tableone
To install this package with conda, run:
conda install -c conda-forge tableone
from tableone import TableOne, load_dataset
import pandas as pd
data=load_dataset('pn2012')
columns = ['Age', 'SysABP', 'Height', 'Weight', 'ICU', 'death']
categorical = ['ICU', 'death']
continuous = ['Age', 'SysABP', 'Height', 'Weight']
groupby = 'death'
nonnormal = ['Age']
rename={'death': 'mortality'}
mytable = TableOne(data, columns=columns, categorical=categorical, continuous=continuous, groupby=groupby, nonnormal=nonnormal, rename=rename, pval=False)
tabulate method. The tablefmt argument allows the table to be displayed in multiple formats, including "github", "grid", "fancy_grid", "rst", "html", and "latex".print(mytable.tabulate(tablefmt = "fancy_grid"))
Grouped by mortality:
| Missing | 0 | 1 | ||
|---|---|---|---|---|
| n | 864 | 136 | ||
| Age | 0 | 66 [52,78] | 75 [62,83] | |
| SysABP | 291 | 115.36 (38.34) | 107.57 (49.43) | |
| Height | 475 | 170.33 (23.22) | 168.51 (11.31) | |
| Weight | 302 | 83.04 (23.58) | 82.29 (25.40) | |
| ICU | CCU | 0 | 137 (15.86) | 25 (18.38) |
| CSRU | 194 (22.45) | 8 (5.88) | ||
| MICU | 318 (36.81) | 62 (45.59) | ||
| SICU | 215 (24.88) | 41 (30.15) | ||
| mortality | 0 | 0 | 864 (100.0) | |
| 1 | 136 (100.0) |
to_format method on the tableone object. For example, mytable can be exported to an Excel spreadsheet named 'mytable.xlsx' with the following command:mytable.to_excel('mytable.xlsx')
FAQs
tableone is a package for creating 'Table 1' summary statistics for a patient population.
We found that tableone demonstrated a healthy version release cadence and project activity because the last version was released less than a year ago. It has 3 open source maintainers collaborating on the project.
Did you know?

Socket for GitHub automatically highlights issues in each pull request and monitors the health of all your open source dependencies. Discover the contents of your packages and block harmful activity before you install or update your dependencies.
Product
Ensure open-source compliance with Socket’s License Enforcement Beta. Set up your License Policy and secure your software!
Product
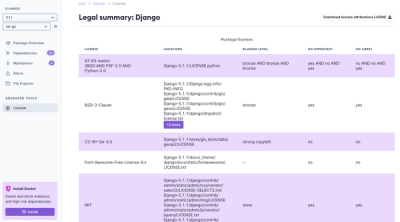
We're launching a new set of license analysis and compliance features for analyzing, managing, and complying with licenses across a range of supported languages and ecosystems.
Product
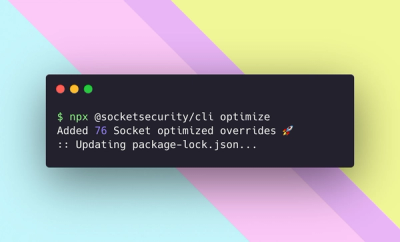
We're excited to introduce Socket Optimize, a powerful CLI command to secure open source dependencies with tested, optimized package overrides.