Security News
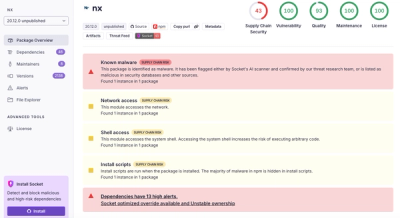
Nx npm Packages Compromised in Supply Chain Attack Weaponizing AI CLI Tools
Malicious Nx npm versions stole secrets and wallet info using AI CLI tools; Socket’s AI scanner detected the supply chain attack and flagged the malware.
ruby-collectd lets you send statistics to collectd from Ruby.
This can be useful if you want to instrument data from within daemons or servers written in Ruby.
ruby-collectd works by talking the collectd network protocol, and
sending stats periodicially to a network-aware instance of collectd.
You need to have collectd load the network plugin, and listen on UDP
port 25826 (so it's acting as a server):
::
LoadPlugin network
<Plugin "network"> Listen "ff18::efc0:4a42"
To install the gem, make sure the Gemcutter RubyGems server is known to your local RubyGems, then install it:
::
gem sources -a http://gemcutter.org gem install collectd
Add sudo in front of the gem install command if you want it to be
installed system wide.
::
require 'rubygems'
require 'collectd'
First of all, specify a server to send data to:
::
Collectd.add_server(interval=10, addr='ff18::efc0:4a42', port=25826)
Each server you add will receive all the data you push later.
An interval of 10 is quite reasonable. Because of UDP and collectd's
network buffering, you can set the interval to less than 10, but you
won't see much benefit.
ruby-collectd gives you a free data collector out of the box, and it's
a nice gentle introduction to instrumenting your app.
To collect memory and CPU statistics of your Ruby process, do:
::
Stats = Collectd.my_process(:woo_data)
Stats.with_full_proc_stats
In the first line, we set up a new plugin. my_process is the plugin
name (magically handled by method_missing), and :woo_data is the
plugin instance.
A plugin name is generally an application's name, and a plugin instance is a unique identifier of an instance of an application (i.e. you have multiple daemons or scripts running at the same time).
In the second line, with_full_proc_stats is a method provided by
ruby-collectd that collects stats about the current running process.
It makes use of polled gauges, which we talk about later.
Behind the scenes, with_full_proc_stats is using a simple interface
you can use to instrument your own data.
Back in the first line we set up a plugin which we wanted to record some
data on. with_full_proc_stats sets up types, which are a kind of data
you are measuring (in this case CPU and memory usage).
You can do this yourself like this:
::
Stats = Collectd.my_daemon(:backend)

# Set counter absolutely
Stats.my_counter(:my_sleep).counter = 0
Stats.my_gauge(:my_gauge).gauge = 23

loop do
  # Increment counter relatively
  Stats.my_counter(:my_sleep).count! 5
  # Set gauge absolutely
  Stats.my_gauge(:my_stack).gauge = rand(40)
  sleep 5
end
(Don't worry if this doesn't make sense - gauges and counters are explained below)
You can also poll for your data, if you feel comfortable with that:
::
Stats.counter(:seconds_elapsed).polled_counter do
  Time.now.to_i
end
collectd groups data by six categories:
hostname -fA value can be either of two types:
.. _types.db: http://collectd.org/documentation/manpages/types.db.5.shtml
FAQs
Unknown package
We found that collectd demonstrated a not healthy version release cadence and project activity because the last version was released a year ago. It has 1 open source maintainer collaborating on the project.
Did you know?

Socket for GitHub automatically highlights issues in each pull request and monitors the health of all your open source dependencies. Discover the contents of your packages and block harmful activity before you install or update your dependencies.

Security News
Malicious Nx npm versions stole secrets and wallet info using AI CLI tools; Socket’s AI scanner detected the supply chain attack and flagged the malware.

Security News
CISA’s 2025 draft SBOM guidance adds new fields like hashes, licenses, and tool metadata to make software inventories more actionable.

Security News
A clarification on our recent research investigating 60 malicious Ruby gems.