Security News
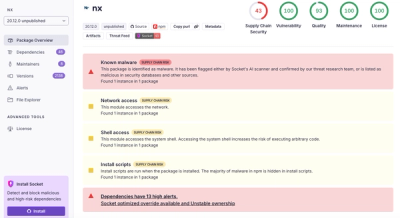
Nx npm Packages Compromised in Supply Chain Attack Weaponizing AI CLI Tools
Malicious Nx npm versions stole secrets and wallet info using AI CLI tools; Socket’s AI scanner detected the supply chain attack and flagged the malware.
Tracee is a development toolkit.
Primarily, it includes a simple extensible logger with stack tracing, benchmarking, preprocessing, and severity-based output splitting. The logger is designed for development and debugging of any type of an application or a library, and is compatible with Rails. The main reason of its existence is to help a developer to see through a stack. However, it can live in a production environment as well.
Secondarily, it decorates exception's backtracing by pointing out actual lines of code that has led to an error, and by grouping callers from indentical lines.
Caller processing. A logger instance when configured appropriately (see below), will process a caller trace of each call to it.
That means you can easily figure out from which exact line did each message come from, and concentrate on debugging rather than marking up log messages.
You can also specify a slice of a trace which would be logged along with a specific call to the logger instance.
Preprocessors pipeline. A logger is easily extensible by any amount of #call'able objects which affect a message logging.
You can configure a pipeline that will in turn format or just silence a message according to its semantics or source, copy something interesting into a DB, rotate a log file, and do anything else.
Splitted streaming. Tracee can stream to any number of IOs simultaneously and conditionally.
If you're a fan of tail -f, with Tracee you can run tail -f log/development.info.log to read only the messages you're interested in the most time. And in the moment you think the last logs from the "debug" channel would be helpful (for example, you detect a floating bug), you run tail -f log/development.debug.log
and read all the last messages from the "debug" channel along with ones from "info", "warn" etc.
As well, you can read the "warn" channel which collects only the messages of the "warn" and higher levels.
Benchmarking. Tracee logger provides simple benchmarking capabilities, measuring a block and a call-to-call time difference.
Using the logger you're able to measure weak spots in a block, getting a call-to-call report illustrated with the power of caller tracing.
Add this line to your application's Gemfile:
gem 'tracee'
And then execute:
$ bundle
Or install it into your current gemset as:
$ gem install tracee
As you start, you get a $log variable unless it's already defined. It is there to present a basic usage of Tracee::Logger.
$log.debug "Starting process..."
# 13:43:01.632 DEBUG [(irb):1 :irb_binding]: Starting process...
$log.info ["Got response:", {code: 200, body: "Hello"}]
# 13:43:20.524 INFO [(irb):2 :irb_binding]: ["Got response:", {:code=>200, :body=>"Hello"}]
$log.warn "Oops, something went wrong!"
# 13:43:32.030 WARN [(irb):3 :irb_binding]: Oops, something went wrong!
#debug, #info and #warn aliased with #<=, #<< and #< respectively, so you can do << to your log.
Log level might be overriden globally by LOGLEVEL env variable, e.g. LOGLEVEL=DEBUG or LOGLEVEL=FATAL. Default level is INFO.
A common logger for Rails is initialized like this
# config/environments/development.rb or a kind of a config file in your non-rails app
  config.logger = Tracee::Logger.new(
    # (optional) A list of #call'able objects which format messages in a chain
    # based on the current datetime, a message level, and a caller trace slice, and can throw :halt to prevent logging of the message
    preprocessors: [:quiet_assets], # or Tracee::Preprocessors::QuietAssets.new
    # A #call'able object being the last in a preprocessors chain.
    # It is distinguished to support compatibility with a default Logger
    formatter: {:formatter => [:plain]}, # or Tracee::Preprocessors::Formatter.new(:plain), which would not do any formatting at all as a default Logger would
    # A list of IOs or references the processed log messages will be written to
    streams: [$stdout, # a reference to IO
              {cascade: "#{config.root}/log/development.%{level}.log"}, # a set of paths inferred from a message severity (level)
       		  "#{config.root}/log/development.log"], # a default path to which a default Rails logger would write messages
    # Log level. You can set it by a number (0-5), a symbol, a string of any case, or to a Logger:: or Tracee::Logger:: constant. Rails resets it based on config.log_level value
    level: :debug
  )
However, the point of Tracee is to have another logger instance with another formatter's template which will highlight the messages been through it.
For example,
# config/initializers/tracee.rb
$log = Tracee::Logger.new(
  streams: [$stdout, {cascade: "#{Rails.root}/log/#{Rails.env}.%{level}.log"}],
  formatter: {:formatter => [:tracee]} # :tracee template will colorize messages and print a reference to the line a logger was called from along with a datetime and a message severity
)
Since Heroku filesystem is ephemeral, file output has little sense there and log/ folder is not initialized by default.
If you deploy to Heroku, make sure in your production Rails environment Tracee::Logger is initialized with streams: [$stdout] to not run into weird issues.
A preprocessor is a callable object which inherits from Tracee::Preprocessors::Base and implements a #call method with 5 arguments:
Formatter renders a template into an output message using the scope of logger call. There are 3 templates predefined:
{D, I, W, E, F, U}, [2000-10-20T11:22:33.123456 #%{pid}] {DEBUG, INFO, WARN, ERROR, FATAL, UNKNOWN} -- %{progname}: %{message}11:22:33.123 {DEBUG, INFO, WARN, ERROR, FATAL, UNKNOWN} [%{file}:%{line} :%{method}]: %{message}%{message}To figure out what is that all about, see Tracee::Preprocessors::Formatter::TEMPLATES constant which is a hash with processable values. You can set as the first argument to Tracee::Preprocessors::Formatter something formed like one of them.
Notice that a logger whose formatter template does not include the %{caller} interpolation key, will not process a caller at all.
Using a formatter that processes a caller, by default you would see within every log message a reference to the line from which a logger had been called, e.g.
# app/models/user.rb, this line is 40
  def mark_dialog_as_read(contact_id)
    $log.info contact_id

# logs
11:22:33.123 INFO [user.rb:42 :mark_dialog_as_read]: 1265
but you can tell a logger to pick a caller stack slice by providing the :caller_at => < Integer | Range | Array<Integer | Range> > option. For more processable call forms see spec/logger_spec.rb.
# app/controllers/dialogs_controller.rb, this line is 138
  def show(contact_id)
    current_user.mark_dialog_as_read(params[:contact_id])

# app/models/user.rb, this line is 40
  def mark_dialog_as_read(contact_id)
    $log.info contact_id, caller_at: 0..1

# logs
11:22:33.123 INFO [dialogs_controller.rb:140 :show -> user.rb:42 :mark_dialog_as_read]: 1265
Now you know for sure where the method is being called from.
Tracee::Stream is a proxy for an IO. It can be initialized with
:cascade key and a file path value with the %{level} interpolation key.Initialized with a Hash, the Stream will write exactly to the IOs which is associated with the levels between the current log level of a logger instance and the incoming message level.
If you want to direct messages to a stream which is neither inherited from IO, nor StringIO, nor is a file path, then your stream object should at least respond to #<< method, and you should explicitly use Tracee::IndifferentStream as a logger stream:
logger = Tracee::Logger.new stream: Tracee::IndifferentStream.new(my_stream)
or
logger = Tracee::Logger.new stream: Tracee::IndifferentStream.new(debug: my_verbose_stream, info: my_not_so_verbose_stream, error: my_crucial_stream)
Tracee can perform simple benchmarking, measuring call-to-call time difference.
logger.tick! starts or resets a measurement.
Each consequent logger.tick will log a time difference between the current #tick and the previous #tick or #tick!.
A tick can accept a message that would go to the "info" channel.
If a logger level is higher than "info" then no benchmarking would be performed at all. Though, this behaviour may change in the next versions.
To measure a block time you can run
logger.benchmark do # something
Suppose, we have a code that is executed for about 100ms, but it seems to be too long. You measure time in 5 points between calls, and it gives you in turn:
 0.025997, 0.012339, 0.037864, 0.0415   # the first turn
 0.01658, 0.011366, 0.046607, 0.052117  # the second turn
 0.016733, 0.011295, 0.032805, 0.036667 # the third turn
How long has each block of code been executed actually?
The code runtime may fluctuate slightly because a PC does some work beside your benchmarking.
The less the code execution time, the more relative fluctuations are. Thats why we do enough passes to minify them.
This module allows to not only measure time between arbitrary calls (ticks),
and to not only get an average from multiple repeats of a block,
but also to get a list of averages between each tick in a block.
def retard
  $log.tick!
  sleep 0.001; $log.tick
  sleep 0.01;  $log.tick
  sleep 0.1;   $log.tick
  $log << 'Got to say something...'
  'Hello!'
end

$log.benchmark(times: 20) {retard} # execute a block 20 times

#logs
03:11:47.365 INFO [(irb):3 :retard]: [tick +0.022103]
03:11:47.375 INFO [(irb):4 :retard]: [tick +0.202998]
03:11:47.476 INFO [(irb):5 :retard]: [tick +2.003133]
03:11:47.476 INFO [(irb):6 :retard]: Got to say something...
03:11:47.477 INFO [(irb):10 :irb_binding]: [111.489342ms each; 2229.786832ms total] Hello!
As you may have noticed, a logger had been silenced until the last pass.
Tracee::Logger is compatible with ActiveSupport::TaggedLogging through a metaprogrammagick. If you want to use it, initialize a logger like this:
config.logger = ActiveSupport::TaggedLogging.new(Tracee::Logger.new)
Tracee makes exception's backtraces look more informative by
Unless you're from Python, it's easier to show than to tell,
001:0> load 'spec/exception_example.rb'
### => true
002:0> Bomb::Wick.new.light!
RuntimeError: It has appeared too wet!
        from /home/shinku/gems/tracee/spec/exception_example.rb:8:in `boom!'
   >>       fail "It has appeared too wet!"
        from /home/shinku/gems/tracee/spec/exception_example.rb:17:in `raise!' -> `loop' -> `raise!' -> `loop' -> `raise! {2}'
   >>           loop {loop {Bomb.new.boom! if (t += 1) == 100}}
        from /home/shinku/gems/tracee/spec/exception_example.rb:23:in `heat!'
   >>         Temperature.new.raise!
        from /home/shinku/gems/tracee/spec/exception_example.rb:31:in `light!'
   >>         Explosive.new.heat!
        from (irb):2
   >>   Bomb::Wick.new.light!
This feature is integrated with BetterErrors and ActiveSupport::BacktraceCleaner to format a trace of exceptions that would be raised within Rails server environment before send it to a logger.
Though, in order to use trace decorator with BetterErrors, Tracee must be loaded prior to BetterErrors,
e.g. in Gemfile
gem 'better_errors', require: ['tracee', 'better_errors']
To enable it in a console, put
Tracee.decorate_exceptions_stack
into .irbrc or similar repl config file after require 'tracee'.
To enable it in a non-Rails application, call
Tracee.decorate_exceptions_stack
at a moment when an application has mostly been loaded.
However, don't run it from a Rails initializer, because it will significantly slowdown the Rails middleware.
For the last 3 years I have an idea of a logger that would stream by a WebSocket an HTML with lots of stack info (variable values) which I then could fold/unfold by hands and analyze by some 3rd party software.
By and large, we have the BetterErrors for such a thing for unhandled exceptions in a Rack-based application.
However, what I want to achieve may be of a much help to solve floating bugs, especially in those cases when to raise an exception is just inacceptable.
Bug reports and pull requests are welcome on GitHub at https://github.com/tinbka/tracee.
FAQs
Unknown package
We found that tracee demonstrated a not healthy version release cadence and project activity because the last version was released a year ago. It has 1 open source maintainer collaborating on the project.
Did you know?

Socket for GitHub automatically highlights issues in each pull request and monitors the health of all your open source dependencies. Discover the contents of your packages and block harmful activity before you install or update your dependencies.

Security News
Malicious Nx npm versions stole secrets and wallet info using AI CLI tools; Socket’s AI scanner detected the supply chain attack and flagged the malware.

Security News
CISA’s 2025 draft SBOM guidance adds new fields like hashes, licenses, and tool metadata to make software inventories more actionable.

Security News
A clarification on our recent research investigating 60 malicious Ruby gems.