Security News
Deno 2.2 Improves Dependency Management and Expands Node.js Compatibility
Deno 2.2 enhances Node.js compatibility, improves dependency management, adds OpenTelemetry support, and expands linting and task automation for developers.
github.com/LifeMemoryTeam/slack-grafana-image-renderer-picker
Pick graph with Slack Slash Command from Grafana Image Renderer and post graph image to Slack.

Please read docker-compose.yml
You need register an Slack Application for Slash Command and files:write permission token.
Slash command can be configured as follows:
Command: /graph
Request URL: https://your_server_host/slash
Short Description: Get Grafana Panel by alias
Usage Hint: [cpu|memory|disk] \d+[m|h|d|M]
Configuration file be specified as follows:
slack:
   token: xoxb-test # Slack Token (needs files:write permission)
   secret: 6e50     # Slack Verification Token
   addr: ":8080"    # Slash Command Server Listen Address
grafana:
   endpoint: "http://localhost:3000/" # Grafana Endpoint
   use_client_auth: true              # Enable Client Authentication for Auth Proxy
   client_auth_p12: "/ssl/key.p12"    # Certificate file (P12)
dashboards:
   -  name: disk                          # Graph Alias (string)
      dashboardId: "000000012"            # Graph Dashboard ID
      dashboardName: alerts-linux-nodes   # Graph Dashboard Name
      orgId: 1                            # Graph Org ID
      panelId: 1                          # Graph Panel ID
   -  name: cpu
      dashboardId: "000000012"
      dashboardName: alerts-linux-nodes
      orgId: 1
      panelId: 4
   -  name: memory
      dashboardId: "000000012"
      dashboardName: alerts-linux-nodes
      orgId: 1
      panelId: 5
dashboards specify a graph panel to be upload with Slack slash command. You can get the parameters of the graph panel by selecting the panel in Grafana and clicking on the share button.
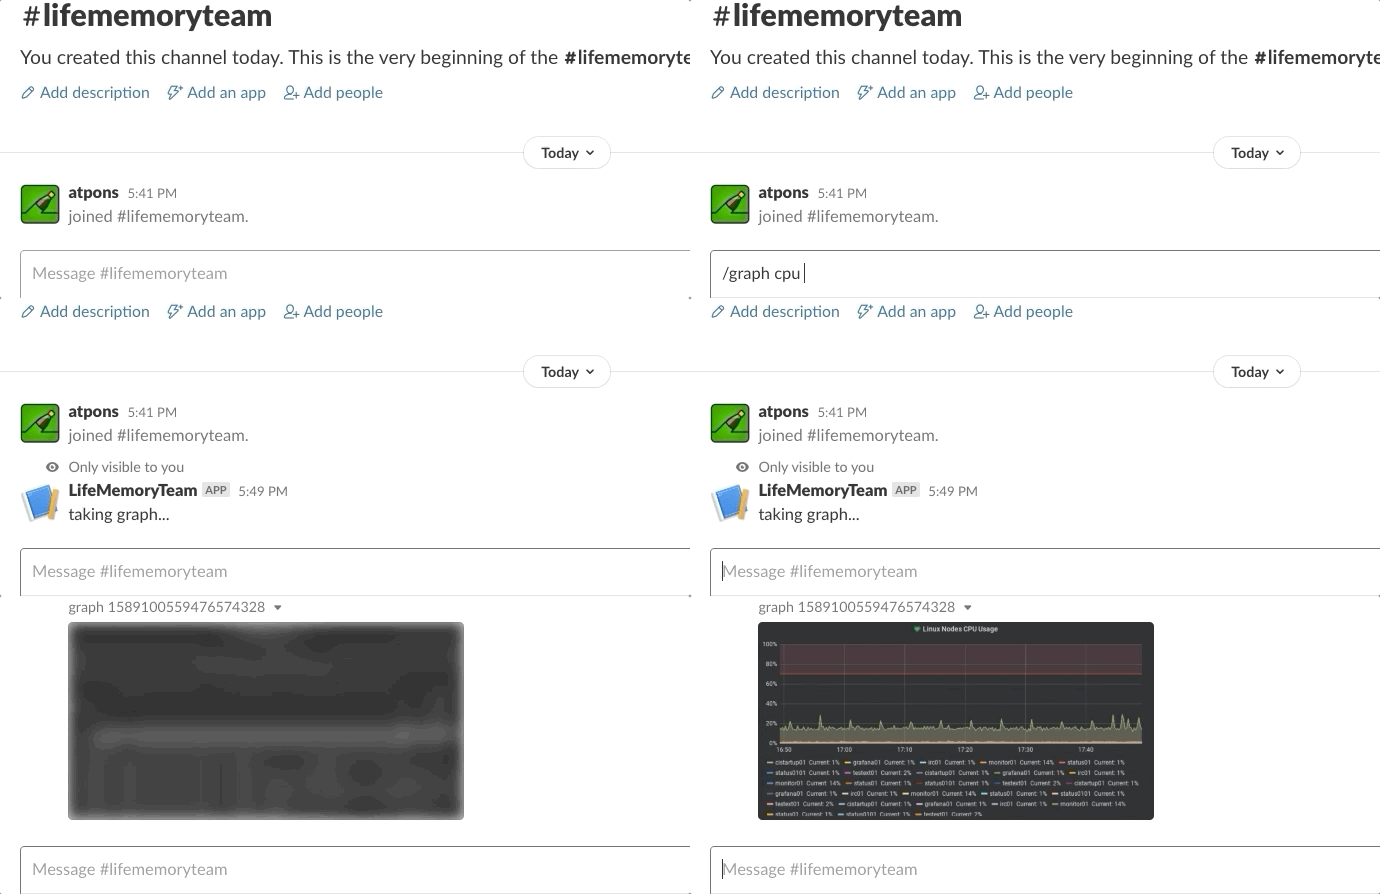
name specifies the alias of a graph. So you can get a graph in Slack like /graph cpu.
This application needs PKCS12 File (.p12) and password, and you need to enable use_client_auth and specify p12 file path on client_auth_p12 at config.yaml.
Run with environment: CONFIG_FILE=config.yaml CLIENT_AUTH_PASSWORD=p12_password
Run with environment: CONFIG_FILE=config.yaml GRAFANA_API_KEY=apikey
Invoke with /graph <alias> (<from_time_range>) (No <from_time_range> with default time range)
Example <from_time_range>: 15m 3h 1d 1M
FAQs
Unknown package
Did you know?

Socket for GitHub automatically highlights issues in each pull request and monitors the health of all your open source dependencies. Discover the contents of your packages and block harmful activity before you install or update your dependencies.

Security News
Deno 2.2 enhances Node.js compatibility, improves dependency management, adds OpenTelemetry support, and expands linting and task automation for developers.

Security News
React's CRA deprecation announcement sparked community criticism over framework recommendations, leading to quick updates acknowledging build tools like Vite as valid alternatives.

Security News
Ransomware payment rates hit an all-time low in 2024 as law enforcement crackdowns, stronger defenses, and shifting policies make attacks riskier and less profitable.