Security News
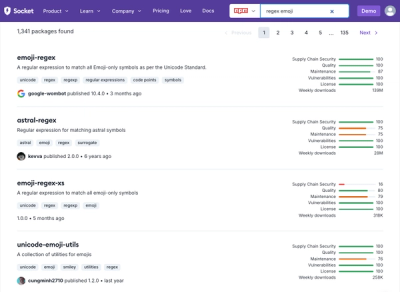
Weekly Downloads Now Available in npm Package Search Results
Socket's package search now displays weekly downloads for npm packages, helping developers quickly assess popularity and make more informed decisions.
github.com/YaroslavPodorvanov/go-grpc-prometheus
:warning: We consolidating projects and moving to single repo where we have more control and awareness. We are moving this codebase for longterm to https://github.com/grpc-ecosystem/go-grpc-middleware/tree/v2. Existing state of Prometheus middleware was moved to https://github.com/grpc-ecosystem/go-grpc-middleware/tree/v2/providers/openmetrics If you want to change something effectively long term, I would suggest proposing PR against https://github.com/grpc-ecosystem/go-grpc-middleware/tree/v2/providers/openmetrics instead (notice
v2branch, not master!).
Prometheus monitoring for your gRPC Go servers and clients.
A sister implementation for gRPC Java (same metrics, same semantics) is in grpc-ecosystem/java-grpc-prometheus.
gRPC Go recently acquired support for Interceptors, i.e. middleware that is executed by a gRPC Server before the request is passed onto the user's application logic. It is a perfect way to implement common patterns: auth, logging and... monitoring.
To use Interceptors in chains, please see go-grpc-middleware.
This library requires Go 1.9 or later.
There are two types of interceptors: client-side and server-side. This package provides monitoring Interceptors for both.
import "github.com/grpc-ecosystem/go-grpc-prometheus"
...
    // Initialize your gRPC server's interceptor.
    myServer := grpc.NewServer(
        grpc.StreamInterceptor(grpc_prometheus.StreamServerInterceptor),
        grpc.UnaryInterceptor(grpc_prometheus.UnaryServerInterceptor),
    )
    // Register your gRPC service implementations.
    myservice.RegisterMyServiceServer(s.server, &myServiceImpl{})
    // After all your registrations, make sure all of the Prometheus metrics are initialized.
    grpc_prometheus.Register(myServer)
    // Register Prometheus metrics handler.
    http.Handle("/metrics", promhttp.Handler())
...
import "github.com/grpc-ecosystem/go-grpc-prometheus"
...
   clientConn, err = grpc.Dial(
       address,
		   grpc.WithUnaryInterceptor(grpc_prometheus.UnaryClientInterceptor),
		   grpc.WithStreamInterceptor(grpc_prometheus.StreamClientInterceptor)
   )
   client = pb_testproto.NewTestServiceClient(clientConn)
   resp, err := client.PingEmpty(s.ctx, &myservice.Request{Msg: "hello"})
...
All server-side metrics start with grpc_server as Prometheus subsystem name. All client-side metrics start with grpc_client. Both of them have mirror-concepts. Similarly all methods
contain the same rich labels:
grpc_service - the gRPC service name, which is the combination of protobuf package and
the grpc_service section name. E.g. for package = mwitkow.testproto and
service TestService the label will be grpc_service="mwitkow.testproto.TestService"
grpc_method - the name of the method called on the gRPC service. E.g.
grpc_method="Ping"
grpc_type - the gRPC type of request.
Differentiating between the two is important especially for latency measurements.
unary is single request, single response RPCclient_stream is a multi-request, single response RPCserver_stream is a single request, multi-response RPCbidi_stream is a multi-request, multi-response RPCAdditionally for completed RPCs, the following labels are used:
grpc_code - the human-readable gRPC status code.
The list of all statuses is to long, but here are some common ones:
OK - means the RPC was successfulIllegalArgument - RPC contained bad valuesInternal - server-side error not disclosed to the clientsThe counters and their up to date documentation is in server_reporter.go and client_reporter.go
the respective Prometheus handler (usually /metrics).
For the purpose of this documentation we will only discuss grpc_server metrics. The grpc_client ones contain mirror concepts.
For simplicity, let's assume we're tracking a single server-side RPC call of mwitkow.testproto.TestService,
calling the method PingList. The call succeeds and returns 20 messages in the stream.
First, immediately after the server receives the call it will increment the
grpc_server_started_total and start the handling time clock (if histograms are enabled).
grpc_server_started_total{grpc_method="PingList",grpc_service="mwitkow.testproto.TestService",grpc_type="server_stream"} 1
Then the user logic gets invoked. It receives one message from the client containing the request
(it's a server_stream):
grpc_server_msg_received_total{grpc_method="PingList",grpc_service="mwitkow.testproto.TestService",grpc_type="server_stream"} 1
The user logic may return an error, or send multiple messages back to the client. In this case, on each of the 20 messages sent back, a counter will be incremented:
grpc_server_msg_sent_total{grpc_method="PingList",grpc_service="mwitkow.testproto.TestService",grpc_type="server_stream"} 20
After the call completes, its status (OK or other gRPC status code)
and the relevant call labels increment the grpc_server_handled_total counter.
grpc_server_handled_total{grpc_code="OK",grpc_method="PingList",grpc_service="mwitkow.testproto.TestService",grpc_type="server_stream",source="internal"} 1
Prometheus histograms are a great way to measure latency distributions of your RPCs. However, since it is bad practice to have metrics of high cardinality the latency monitoring metrics are disabled by default. To enable them please call the following in your server initialization code:
grpc_prometheus.EnableHandlingTimeHistogram()
After the call completes, its handling time will be recorded in a Prometheus histogram
variable grpc_server_handling_seconds. The histogram variable contains three sub-metrics:
grpc_server_handling_seconds_count - the count of all completed RPCs by status and methodgrpc_server_handling_seconds_sum - cumulative time of RPCs by status and method, useful for
calculating average handling timesgrpc_server_handling_seconds_bucket - contains the counts of RPCs by status and method in respective
handling-time buckets. These buckets can be used by Prometheus to estimate SLAs (see here)The counter values will look as follows:
grpc_server_handling_seconds_bucket{grpc_code="OK",grpc_method="PingList",grpc_service="mwitkow.testproto.TestService",grpc_type="server_stream",le="0.005"} 1
grpc_server_handling_seconds_bucket{grpc_code="OK",grpc_method="PingList",grpc_service="mwitkow.testproto.TestService",grpc_type="server_stream",le="0.01"} 1
grpc_server_handling_seconds_bucket{grpc_code="OK",grpc_method="PingList",grpc_service="mwitkow.testproto.TestService",grpc_type="server_stream",le="0.025"} 1
grpc_server_handling_seconds_bucket{grpc_code="OK",grpc_method="PingList",grpc_service="mwitkow.testproto.TestService",grpc_type="server_stream",le="0.05"} 1
grpc_server_handling_seconds_bucket{grpc_code="OK",grpc_method="PingList",grpc_service="mwitkow.testproto.TestService",grpc_type="server_stream",le="0.1"} 1
grpc_server_handling_seconds_bucket{grpc_code="OK",grpc_method="PingList",grpc_service="mwitkow.testproto.TestService",grpc_type="server_stream",le="0.25"} 1
grpc_server_handling_seconds_bucket{grpc_code="OK",grpc_method="PingList",grpc_service="mwitkow.testproto.TestService",grpc_type="server_stream",le="0.5"} 1
grpc_server_handling_seconds_bucket{grpc_code="OK",grpc_method="PingList",grpc_service="mwitkow.testproto.TestService",grpc_type="server_stream",le="1"} 1
grpc_server_handling_seconds_bucket{grpc_code="OK",grpc_method="PingList",grpc_service="mwitkow.testproto.TestService",grpc_type="server_stream",le="2.5"} 1
grpc_server_handling_seconds_bucket{grpc_code="OK",grpc_method="PingList",grpc_service="mwitkow.testproto.TestService",grpc_type="server_stream",le="5"} 1
grpc_server_handling_seconds_bucket{grpc_code="OK",grpc_method="PingList",grpc_service="mwitkow.testproto.TestService",grpc_type="server_stream",le="10"} 1
grpc_server_handling_seconds_bucket{grpc_code="OK",grpc_method="PingList",grpc_service="mwitkow.testproto.TestService",grpc_type="server_stream",le="+Inf"} 1
grpc_server_handling_seconds_sum{grpc_code="OK",grpc_method="PingList",grpc_service="mwitkow.testproto.TestService",grpc_type="server_stream"} 0.0003866430000000001
grpc_server_handling_seconds_count{grpc_code="OK",grpc_method="PingList",grpc_service="mwitkow.testproto.TestService",grpc_type="server_stream"} 1
Prometheus philosophy is to provide raw metrics to the monitoring system, and let the aggregations be handled there. The verbosity of above metrics make it possible to have that flexibility. Here's a couple of useful monitoring queries:
sum(rate(grpc_server_started_total{job="foo"}[1m])) by (grpc_service)
For job="foo" (common label to differentiate between Prometheus monitoring targets), calculate the
rate of requests per second (1 minute window) for each gRPC grpc_service that the job has. Please note
how the grpc_method is being omitted here: all methods of a given gRPC service will be summed together.
sum(rate(grpc_server_handled_total{job="foo",grpc_type="unary",grpc_code!="OK"}[1m])) by (grpc_service)
For job="foo", calculate the per-grpc_service rate of unary (1:1) RPCs that failed, i.e. the
ones that didn't finish with OK code.
sum(rate(grpc_server_handled_total{job="foo",grpc_type="unary",grpc_code!="OK"}[1m])) by (grpc_service)
 /
sum(rate(grpc_server_started_total{job="foo",grpc_type="unary"}[1m])) by (grpc_service)
 * 100.0
For job="foo", calculate the percentage of failed requests by service. It's easy to notice that
this is a combination of the two above examples. This is an example of a query you would like to
alert on in your system for SLA violations, e.g.
"no more than 1% requests should fail".
sum(rate(grpc_server_msg_sent_total{job="foo",grpc_type="server_stream"}[10m])) by (grpc_service)
 /
sum(rate(grpc_server_started_total{job="foo",grpc_type="server_stream"}[10m])) by (grpc_service)
For job="foo" what is the grpc_service-wide 10m average of messages returned for all server_stream RPCs. This allows you to track the stream sizes returned by your system, e.g. allows
you to track when clients started to send "wide" queries that ret
Note the divisor is the number of started RPCs, in order to account for in-flight requests.
histogram_quantile(0.99,
  sum(rate(grpc_server_handling_seconds_bucket{job="foo",grpc_type="unary"}[5m])) by (grpc_service,le)
)
For job="foo", returns an 99%-tile quantile estimation
of the handling time of RPCs per service. Please note the 5m rate, this means that the quantile
estimation will take samples in a rolling 5m window. When combined with other quantiles
(e.g. 50%, 90%), this query gives you tremendous insight into the responsiveness of your system
(e.g. impact of caching).
100.0 - (
sum(rate(grpc_server_handling_seconds_bucket{job="foo",grpc_type="unary",le="0.25"}[5m])) by (grpc_service)
 /
sum(rate(grpc_server_handling_seconds_count{job="foo",grpc_type="unary"}[5m])) by (grpc_service)
) * 100.0
For job="foo" calculate the by-grpc_service fraction of slow requests that took longer than 0.25
seconds. This query is relatively complex, since the Prometheus aggregations use le (less or equal)
buckets, meaning that counting "fast" requests fractions is easier. However, simple maths helps.
This is an example of a query you would like to alert on in your system for SLA violations,
e.g. "less than 1% of requests are slower than 250ms".
This code has been used since August 2015 as the basis for monitoring of production gRPC micro services at Improbable.
go-grpc-prometheus is released under the Apache 2.0 license. See the LICENSE file for details.
FAQs
Unknown package
Did you know?

Socket for GitHub automatically highlights issues in each pull request and monitors the health of all your open source dependencies. Discover the contents of your packages and block harmful activity before you install or update your dependencies.

Security News
Socket's package search now displays weekly downloads for npm packages, helping developers quickly assess popularity and make more informed decisions.

Security News
A Stanford study reveals 9.5% of engineers contribute almost nothing, costing tech $90B annually, with remote work fueling the rise of "ghost engineers."

Research
Security News
Socket’s threat research team has detected six malicious npm packages typosquatting popular libraries to insert SSH backdoors.