Security News
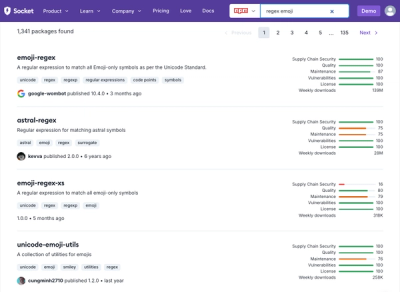
Weekly Downloads Now Available in npm Package Search Results
Socket's package search now displays weekly downloads for npm packages, helping developers quickly assess popularity and make more informed decisions.
github.com/codeyourfuture/immersive-go-course/grpc-client-server
+++ title="GRPC Client and Server Communication" author="Laura Nolan" +++
Timebox: 3 days
We've used simple HTTP request so far, making and handling GET and POST requests.
RPC is another way to communicate between clients and servers (or frontends and backends).
It is used commonly within an organisation (it isn't used from browsers), where it has advantages around types, performance, and streaming.
gRPC is not used to communicate from web browsers to servers (important because this is context they have).
RPCs let you call a specific function on another computer. RPCs are highly structured; normally the request and response are encoded in efficient binary formats which are not human-readable. HTTP APIs are usually limited to CRUD (Create, Read, Update, Delete) operations and RPCs can perform any kind of operation.
If you want to efficiently integrate two systems that you control, RPCs are a good choice. If you want to provide an API for use by developers outside of your organisation then HTTP APIs are generally a better choice, because they are simpler to develop against, all programming languages provide good HTTP support, and HTTP works in the browser.
gRPC, which we will use in this exercise, is a RPC implementation that is fairly common in industry.
Read the gRPC Introduction and gRPC Core Concepts for an overview of gRPC.
Run through the gRPC Hello World example from the grpc.io documentation.
This will ensure you have the right tools on your machine and working correctly.
Next, we will implement a simple prober service. Imagine that we want to verify that our site is available and has acceptable latency from many different locations around the world. We build a program that performs HTTP GETs on a provided endpoint and returns statistics about how long it took.
In a real production system, we could run several instances of our prober server in different regions and use one client to query all of the prober servers.
In the same directory as this README you will find initial versions of:
Generate the generated protobuf code:
> protoc --go_out=. --go_opt=paths=source_relative \
--go-grpc_out=. --go-grpc_opt=paths=source_relative \
prober/prober.proto
Observe the new generated files:
> ls prober
> prober.pb.go		prober.proto		prober_grpc.pb.go
Read through prober_grpc.pb.go - this is the interface we will use in our code. This is how gRPC works: a proto format
gets generated into language-specific code that we can use to interact with gRPCs. If we're working with multiple programming languages
that need to interact through RPCs, we can do this by generating from the same protocol buffer definition with the language-specific
tooling.
Now run the server and client code. You should see output like this.
> go run prober_server/main.go
> 2022/10/19 17:51:32 server listening at [::]:50051
> go run prober_client/main.go
> 2022/10/19 17:52:15 Response Time: 117.000000
We've now gained some experience with the protocol buffer format, learned how to generate Go code from protocol buffer definitions, and called that code from Go programs.
Let's modify the prober service slightly. Instead of the simple one-off HTTP GET against a hardcoded google.com, we are going to modify the service to probe an HTTP endpoint N times and return the average time to GET that endpoint to the client.
Change your prober request and response:
ProbeRequest for the number of requests to make.ProbeReply (and perhaps add a comment) to make clear it's the average response time of the several requests.Note that it's ok to rename fields in protobuf (unlike when we use JSON), because the binary encoding of protobuf messages doesn't include field names. However, do note that we need to be very careful about removing proto fields, changing their types, or changing the numerical ordering of fields. In general, these kinds of changes will break your clients because they change the binary encoding format. You can read more about backward/forward compatibility with protobufs if you want.
Remember that you'll need to re-generate your Go code after changing your proto definitions.
Update your client to read the endpoint and number of repetitions from the command line.
Then update your server to execute the probe: do a HTTP fetch of endpoint the specified number of times.
The initial version of the code demonstrates how to use the standard net/http package and the standard time package.
Add up all the elapsed times, divide by the number of repetitions, and return the average to the client.
The client should print out the average value received.
You can do arithmetic operations like addition and division on time.Duration values in Go.
Maybe the site we are probing is very slow (which can happen for all kinds of reasons, from network problems to excessive load), or perhaps the number of repetitions is very high. Either way, we never want our program to wait forever. If we are not careful about preventing this then we can end up building systems where problems in one small part of the system spread across all of the services that talk to that part of the system.
On the client side, add a timeout to stop waiting after 1 second.
Run your client against some website - how many repetitions do you need to see your client timeout?
How do we know if the HTTP fetch succeeded at the server? Add a check to make sure it did.
How should we deal with errors, e.g. if the endpoint isn't found, or says the server is in an error state? Modify your code and proto format to handle these cases.
These sections are optional - do them for an extra challenge if time permits.
Let's learn something about how to monitor applications.
In software operations, we want to know what our software is doing and how it is performing. One very useful technique is to have our program export metrics. Metrics are basically values that your program makes available (the industry standard is to export and scrape over HTTP).
Specialised programs, such as Prometheus, can then fetch metrics regularly from all the running instances of your program, store the history of these metrics, and do useful arithmetic on them (like computing rates, averages, and maximums). We can use this data to do troubleshooting and to alert if things go wrong.
Read the Overview of Prometheus.
Now add Prometheus metrics to your prober server. Every time you execute a probe, update a gauge metric that tracks the latency.
Add a label specifying the endpoint being probed.
The Prometheus Guide to Instrumenting a Go Application has all the information you need to do this.
Once you've run your program, use your client to execute probes against some endpoint.
Now use the curl program or your browser to view the metrics.
You should see a number of built-in Go metrics, plus your new gauge.
If you use your client to start probing a second endpoint, you should see a second labelled metric appear.
The final step is to set up the Prometheus application to periodically pull metrics from your prober_server.
The easiest way to run Prometheus locally is in Docker. This way we can run an up-to-date version that has been built by the Prometheus maintainers. See Prometheus Installation.
You'll need to set up a simple configuration to scrape your prober_server. Prometheus configuration is quite complex but you can adapt this example configuration.
Next, find your custom gauge metric from your prober_server in http://localhost:9090/metrics.
Graph it in http://localhost:9090/graph.
FAQs
Unknown package
Did you know?

Socket for GitHub automatically highlights issues in each pull request and monitors the health of all your open source dependencies. Discover the contents of your packages and block harmful activity before you install or update your dependencies.

Security News
Socket's package search now displays weekly downloads for npm packages, helping developers quickly assess popularity and make more informed decisions.

Security News
A Stanford study reveals 9.5% of engineers contribute almost nothing, costing tech $90B annually, with remote work fueling the rise of "ghost engineers."

Research
Security News
Socket’s threat research team has detected six malicious npm packages typosquatting popular libraries to insert SSH backdoors.