Security News
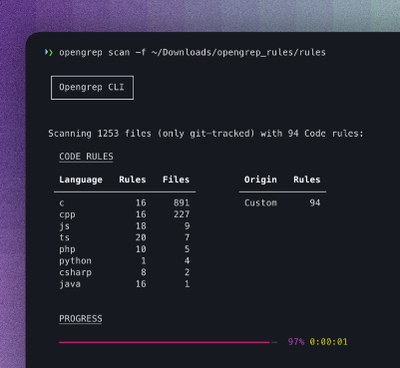
Opengrep Emerges as Open Source Alternative Amid Semgrep Licensing Controversy
Opengrep forks Semgrep to preserve open source SAST in response to controversial licensing changes.
github.com/open-telemetry/opentelemetry-collector-contrib/extension/observer/ecsobserver
| Status | |
|---|---|
| Stability | beta |
| Distributions | contrib |
| Issues |   |
| Code Owners | @dmitryax |
| Emeritus | @rmfitzpatrick |
The ecsobserver uses the ECS/EC2 API to discover prometheus scrape targets from all running tasks and filter them
based on service names, task definitions and container labels.
NOTE: If you run collector as a sidecar, you should consider use ECS resource detector instead. However, it does not have service, EC2 instances etc. because it only queries local API.
The configuration is based on existing cloudwatch agent ECS discovery . A full collector config looks like the following:
extensions:
  ecs_observer:
    refresh_interval: 60s # format is https://golang.org/pkg/time/#ParseDuration
    cluster_name: 'Cluster-1' # cluster name need manual config
    cluster_region: 'us-west-2' # region can be configured directly or use AWS_REGION env var
    result_file: '/etc/ecs_sd_targets.yaml' # the directory for file must already exists
    services:
      - name_pattern: '^retail-.*$'
    docker_labels:
      - port_label: 'ECS_PROMETHEUS_EXPORTER_PORT'
    task_definitions:
      - job_name: 'task_def_1'
        metrics_path: '/metrics'
        metrics_ports:
          - 9113
          - 9090
        arn_pattern: '.*:task-definition/nginx:[0-9]+'

receivers:
  prometheus:
    config:
      scrape_configs:
        - job_name: "ecs-task"
          file_sd_configs:
            - files:
                - '/etc/ecs_sd_targets.yaml' # MUST match the file name in ecs_observer.result_file
          relabel_configs: # Relabel here because label with __ prefix will be dropped by receiver.
            - source_labels: [ __meta_ecs_cluster_name ] # ClusterName
              action: replace
              target_label: ClusterName
            - source_labels: [ __meta_ecs_service_name ] # ServiceName
              action: replace
              target_label: ServiceName
            - action: labelmap # Convert docker labels on container to metric labels
              regex: ^__meta_ecs_container_labels_(.+)$ # Capture the key using regex, e.g. __meta_ecs_container_labels_Java_EMF_Metrics -> Java_EMF_Metrics
              replacement: '$$1'

processors:
  batch:

# Use awsemf for CloudWatch Container Insights Prometheus. The extension does not have requirement on exporter.
exporters:
  awsemf:

service:
  pipelines:
    metrics:
      receivers: [ prometheus ]
      processors: [ batch ]
      exporters: [ awsemf ]
  extensions: [ ecs_observer ]
| Name | Description | |
|---|---|---|
| cluster_name | Mandatory | target ECS cluster name for service discovery |
| cluster_region | Mandatory | target ECS cluster's AWS region name |
| refresh_interval | Optional | how often to look for changes in endpoints (default: 10s) |
| result_file | Mandatory | path of YAML file to write scrape target results. NOTE: the observer always returns empty in initial implementation |
| services | Optional | list of service name patterns detail |
| task_definitions | Optional | list of task definition arn patterns detail |
| docker_labels | Optional | list of docker labels detail |
result_file specifies where to write the discovered targets. It MUST match the files defined in file_sd_configs for
prometheus receiver. See output format for the detailed format.
There are three type of filters, and they share the following common optional properties.
job_namemetrics_pathmetrics_ports an array of port numberExample
ecs_observer:
  job_name: 'ecs-sd-job'
  services:
    - name_pattern: ^retail-.*$
      container_name_pattern: ^java-api-v[12]$
    - name_pattern: game
      metrics_path: /v3/343
      job_name: guilty-spark
  task_definitions:
    - arn_pattern: '*memcached.*'
    - arn_pattern: '^proxy-.*$'
      metrics_ports:
        - 9113
        - 9090
      metrics_path: /internal/metrics
  docker_labels:
    - port_label: ECS_PROMETHEUS_EXPORTER_PORT
    - port_label: ECS_PROMETHEUS_EXPORTER_PORT_V2
      metrics_path_label: ECS_PROMETHEUS_EXPORTER_METRICS_PATH
| Name | Description | |
|---|---|---|
| name_pattern | Mandatory | Regex pattern to match against ECS service name |
| metrics_ports | Mandatory | container ports separated by semicolon. Only containers that expose these ports will be discovered |
| container_name_pattern | Optional | ECS task container name regex pattern |
| Name | Description | |
|---|---|---|
| arn_pattern | Mandatory | Regex pattern to match against ECS task definition ARN |
| metrics_ports | Mandatory | container ports separated by semicolon. Only containers that expose these ports will be discovered |
| container_name_pattern | Optional | ECS task container name regex pattern |
Specify label keys to look up value
| Name | Description | |
|---|---|---|
| port_label | Mandatory | container's docker label name that specifies the metrics port |
| metrics_path_label | Optional | container's docker label name that specifies the metrics path. (Default: "") |
| job_name_label | Optional | container's docker label name that specifies the scrape job name. (Default: "") |
It uses the default credential chain, on ECS it is advised to use ECS task role. You need to deploy the collector as an ECS task/service with the following permissions .
EC2 access is required for getting private IP for ECS EC2. However, EC2 permission can be removed if you are only using Fargate because task ip comes from awsvpc instead of host.
ec2:DescribeInstances
ecs:ListTasks
ecs:ListServices
ecs:DescribeContainerInstances
ecs:DescribeServices
ecs:DescribeTasks
ecs:DescribeTaskDefinition
The extension polls ECS API periodically to get all running tasks and filter out scrape targets. There are 3 types of
filters for discovering targets, targets match the filter are kept. Targets from different filters are merged base
on address/metrics_path before updating/creating receiver.
ECS Service is a deployment that manages multiple tasks with same definition (like Deployment and DaemonSet in k8s).
The service
configuration matches both service name and container name (if not empty).
NOTE: name of the service is added as label value with key ServiceName.
# Example 1: Matches all containers that are started by retail-* service
name_pattern: ^retail-.*$
---
# Example 2: Matches all container with name java-api in cash-app service
name_pattnern: ^cash-app$
container_name_pattern: ^java-api$
---
# Example 3: Override default metrics_path (i.e. /metrics)
name_pattern: ^log-replay-worker$
metrics_path: /v3/metrics
ECS task definition contains one or more containers (like Pod in k8s). Long running applications normally uses service. while short running (batch) jobs can be created from task definitions directly .
The task definition matches both task definition name and container name (of not empty). Optional config
like metrics_path, metrics_ports, job_name can override default value.
# Example 1: Matches all the tasks created from task definition that contains memcached in its arn
arn_pattern: "*memcached.*"
Docker label can be specified in task definition. Only port_label is used when checking if the container should be
included. Optional config like metrics_path_label, job_name_label can override default value.
# Example 1: Matches all the container that has label ECS_PROMETHEUS_EXPORTER_PORT_NGINX
port_label: 'ECS_PROMETHEUS_EXPORTER_PORT_NGINX'
---
# Example 2: Override job name based on label MY_APP_JOB_NAME
port_label: 'ECS_PROMETHEUS_EXPORTER_PORT_MY_APP'
job_name_label: 'MY_APP_JOB_NAME'
There are three ways to notify a receiver
This is current approach used by cloudwatch-agent and also recommended by prometheus . It's easier to debug and the main drawback is it only works for prometheus. Another minor issue is fsnotify may not work properly occasionally and delay the update.
This is a generic approach that creates a new receiver at runtime based on discovered endpoints. The main problem is performance issue as described in this issue.
Because both the collector and prometheus is written in Go, we can call discover.RegisterConfig to make it a valid
config for prometheus (like other in tree plugins like kubernetes). The drawback is the configuration is now under
prometheus instead of extension and can cause confusion.
The format is based on cloudwatch agent , ec2 sd and kubernetes sd. Task and labels from task definition are always included. EC2 info is only included when task is running on ECS EC2 ( i.e. not on Fargate).
Unlike cloudwatch agent, all the additional labels starts with __meta_ecs_ prefix. If they are
not renamed during relabel,
they will all get dropped in prometheus receiver and won't pass down along the pipeline.
The number of dimensions supported by AWS EMF exporter is limited by its backend. The labels can be modified/filtered at different stages, prometheus receiver relabel, Metrics Transform Processor and EMF exporter Metric Declaration
Required for prometheus to scrape the target.
| Label Name | Source | Type | Description |
|---|---|---|---|
__address__ | ECS Task and TaskDefinition | string | host:port host is private ip from ECS Task, port is the mapped port |
__metrics_path__ | ECS TaskDefinition or Config | string | Default is /metrics, changes based on config/label |
job | ECS TaskDefinition or Config | string | Name for scrape job |
Additional information from ECS and EC2.
| Label Name | Source | Type | Description |
|---|---|---|---|
__meta_ecs_task_definition_family | ECS TaskDefinition | string | Name for registered task definition |
__meta_ecs_task_definition_revision | ECS TaskDefinition | int | Version of the task definition being used to run the task |
__meta_ecs_task_launch_type | ECS Task | string | EC2 or FARGATE |
__meta_ecs_task_group | ECS Task | string | Task Group is service:my-service-name or specified when launching task directly |
__meta_ecs_task_tags_<tagkey> | ECS Task | string | Tags specified in CreateService and RunTask |
__meta_ecs_task_container_name | ECS Task | string | Name of container |
__meta_ecs_task_container_label_<labelkey> | ECS TaskDefinition | string | Docker label specified in task definition |
__meta_ecs_task_health_status | ECS Task | string | HEALTHY or UNHEALTHY. UNKNOWN if not configured |
__meta_ecs_ec2_instance_id | EC2 | string | EC2 instance id for EC2 launch type |
__meta_ecs_ec2_instance_type | EC2 | string | EC2 instance type e.g. t3.medium, m6g.xlarge |
__meta_ecs_ec2_tags_<tagkey> | EC2 | string | Tags specified when creating the EC2 instance |
__meta_ecs_ec2_vpc_id | EC2 | string | ID of VPC e.g. vpc-abcdefeg |
__meta_ecs_ec2_private_ip | EC2 | string | Private IP |
__meta_ecs_ec2_public_ip | EC2 | string | Public IP, if available |
map[string]string
instead of []KeyValuetaget// PrometheusECSTarget contains address and labels extracted from a running ECS task
// and its underlying EC2 instance (if available).
//
// For serialization
// - FromLabels and ToLabels converts it between map[string]string.
// - FromTargetYAML and ToTargetYAML converts it between prometheus file discovery format in YAML.
// - FromTargetJSON and ToTargetJSON converts it between prometheus file discovery format in JSON.
type PrometheusECSTarget struct {
Address string `json:"address"`
MetricsPath string `json:"metrics_path"`
Job string `json:"job"`
TaskDefinitionFamily string `json:"task_definition_family"`
TaskDefinitionRevision int `json:"task_definition_revision"`
TaskLaunchType string `json:"task_launch_type"`
TaskGroup string `json:"task_group"`
TaskTags map[string]string `json:"task_tags"`
ContainerName string `json:"container_name"`
ContainerLabels map[string]string `json:"container_labels"`
HealthStatus string `json:"health_status"`
EC2InstanceId string `json:"ec2_instance_id"`
EC2InstanceType string `json:"ec2_instance_type"`
EC2Tags map[string]string `json:"ec2_tags"`
EC2VPCId string `json:"ec2_vpc_id"`
EC2PrivateIP string `json:"ec2_private_ip"`
EC2PublicIP string `json:"ec2_public_ip"`
}
Delta is not supported because there is no watch API in ECS (unlike k8s, see known issues). The output always contains all the targets. Caller/Consumer need to implement their own logic to calculate the targets diff if they only want to process new targets.
hashmod
in relabel_config to do
static sharding. However, too many collectors may trigger the rate limit on AWS API as each shard is fetching ALL the
tasks during discovery regardless of number of shards.The implementation has two parts, core ecs service discovery logic and adapter for notifying discovery results.
extension/observer/ecsobserver main logicThe pseudocode showing the overall flow.
NewECSSD() {
  session := awsconfig.NewSssion()
  ecsClient := awsecs.NewClient(session)
  filters := config.NewFileters()
  decorator := awsec2.NewClient(session)
  for {
    select {
    case <- timer:
      // Fetch ALL
      tasks := ecsClient.FaetchAll()
      // Filter
      filteredTasks := fileters.Apply(tasks)
      // Add EC2 info
      decorator.Apply(filteredTask)
      // Generate output
      if writeResultFile {
         writeFile(fileteredTasks, /etc/ecs_sd.yaml)
      } else {
          notifyObserver()
      }
    }
  }
}
Following metrics are logged at debug level. TODO(pingleig): Is there a way for otel plugins to export custom metrics to otel's own /metrics.
| Name | Type | Description |
|---|---|---|
discovered_targets | int | Number of targets exported |
discovered_taskss | int | Number of tasks that contains scrape target, should be smaller than targets unless each task only contains one target |
ignored_tasks | int | Tasks ignored by filter, discovered_tasks and ignored_tasks should add up to api_ecs_list_task_results, one exception is API paging failed in the middle |
targets_matched_by_service | int | ECS Service name based filter |
targets_matched_by_task_definition | int | ECS TaskDefinition based filter |
targets_matched_by_docker_label | int | ECS DockerLabel based filter |
target_error_noip | int | Export failures because private ip not found |
api_ecs_list_task_results | int | Total number of tasks returned from ECS ListTask API |
api_ecs_list_service_results | int | Total number of services returned from ECS ListService API |
api_error_auth | int | Total number of error triggered by permission |
api_error_rate_limit | int | Total number of error triggered by rate limit |
cache_size_container_instances | int | Cached ECS ContainerInstance |
cache_hit_container_instance | int | Cache hit during the latest polling |
cache_size_ec2_instance | int | Cached EC2 Instance |
cache_hit_ec2_instance | int | Cache hit during the latest polling |
ReportStatus). Although IAM role
can be updated at runtime without restarting the collector, it's better to fail to make the problem obvious. Same
applies to cluster not found. In the future we can add config to downgrade those errors if user want to monitor an ECS
cluster with collector running outside the cluster, the collector can run anywhere as long as it can reach scrape
targets and AWS API.A mock ECS and EC2 server is in internal/ecsmock, see fetcher_test for its usage.
Will be implemented in AOT Testing Framework to run against actual ECS service on both EC2 and Fargate.
FAQs
Unknown package
Did you know?

Socket for GitHub automatically highlights issues in each pull request and monitors the health of all your open source dependencies. Discover the contents of your packages and block harmful activity before you install or update your dependencies.

Security News
Opengrep forks Semgrep to preserve open source SAST in response to controversial licensing changes.

Security News
Critics call the Node.js EOL CVE a misuse of the system, sparking debate over CVE standards and the growing noise in vulnerability databases.

Security News
cURL and Go security teams are publicly rejecting CVSS as flawed for assessing vulnerabilities and are calling for more accurate, context-aware approaches.