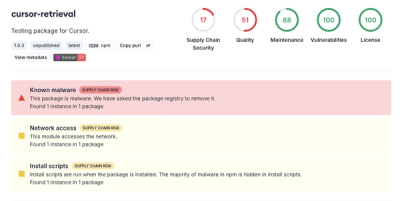
Security News
The Risks of Misguided Research in Supply Chain Security
Snyk's use of malicious npm packages for research raises ethical concerns, highlighting risks in public deployment, data exfiltration, and unauthorized testing.
github.com/open-telemetry/opentelemetry-collector-contrib/receiver/awsecscontainermetricsreceiver
| Status | |
|---|---|
| Stability | beta: metrics |
| Distributions | contrib |
| Issues |   |
| Code Owners | @Aneurysm9 |
AWS ECS Container Metrics Receiver (awsecscontainermetrics) reads task metadata and docker stats from Amazon ECS Task Metadata Endpoint, and generates resource usage metrics (such as CPU, memory, network, and disk) from them. To get the full list of metrics, see the Available Metrics section below.
This receiver works only for ECS Task Metadata Endpoint V4. Amazon ECS tasks on Fargate that use platform version 1.4.0 or later and Amazon ECS tasks on Amazon EC2 that are running at least version 1.39.0 of the Amazon ECS container agent can utilize this receiver. For more information, see Amazon ECS Container Agent Versions.
Example:
receivers:
  awsecscontainermetrics:
    collection_interval: 20s
This receiver collects task metadata and container stats at a fixed interval and emits metrics to the next consumer of OpenTelemetry pipeline. collection_interval will determine the frequency at which metrics are collected and emitted by this receiver.
default: 20s
To enable the awsecscontainermetrics receiver, add the name under receiver section in the OpenTelemetry config file. By default, the receiver scrapes the ECS task metadata endpoint every 20s and collects all metrics (For the full list of metrics, see Available Metrics).
The following configuration collects AWS ECS resource usage metrics by using awsecscontainermetrics receiver and sends them to CloudWatch using awsemf exporter. Check out SETUP section for configuring AWS Distro for OpenTelemetry Collector in Amazon Elastic Container Service.
receivers:
  awsecscontainermetrics:
exporters:
  awsemf:
      namespace: 'ECS/ContainerMetrics/OpenTelemetry'
      log_group_name: '/ecs/containermetrics/opentelemetry'

service:
  pipelines:
      metrics:
          receivers: [awsecscontainermetrics]
          exporters: [awsemf]
Customers can configure collection_interval under awsecscontainermetrics receiver to scrape and gather metrics at a specific interval. The following example configuration will collect metrics every 40 seconds.
receivers:
  awsecscontainermetrics:
      collection_interval: 40s
exporters:
  awsemf:
      namespace: 'ECS/ContainerMetrics/OpenTelemetry'
      log_group_name: '/ecs/containermetrics/opentelemetry'

service:
  pipelines:
      metrics:
          receivers: [awsecscontainermetrics]
          exporters: [awsemf]
The previous configurations collect all the metrics and sends them to Amazon CloudWatch using default names. Customers can use filter and metrictransform processors to send specific metrics and rename them respectively.
The following configuration example collects only the ecs.task.memory.utilized metric and renames it to MemoryUtilized before sending to CloudWatch.
receivers:
  awsecscontainermetrics:
exporters:
  awsemf:
      namespace: 'ECS/ContainerMetrics/OpenTelemetry'
      log_group_name: '/ecs/containermetrics/opentelemetry'
processors:
  filter:
    metrics:
      include:
        match_type: strict
        metric_names:
          - ecs.task.memory.utilized

  metricstransform:
    transforms:
      - include: ecs.task.memory.utilized
        action: update
        new_name: MemoryUtilized

service:
  pipelines:
      metrics:
          receivers: [awsecscontainermetrics]
          processors: [filter, metricstransform]
          exporters: [awsemf]
Following is the full list of metrics emitted by this receiver.
| Task Level Metrics | Container Level Metrics | Unit |
|---|---|---|
| ecs.task.memory.usage | container.memory.usage | Bytes |
| ecs.task.memory.usage.max | container.memory.usage.max | Bytes |
| ecs.task.memory.usage.limit | container.memory.usage.limit | Bytes |
| ecs.task.memory.reserved | container.memory.reserved | Megabytes |
| ecs.task.memory.utilized | container.memory.utilized | Megabytes |
| ecs.task.cpu.usage.total | container.cpu.usage.total | Nanoseconds |
| ecs.task.cpu.usage.kernelmode | container.cpu.usage.kernelmode | Nanoseconds |
| ecs.task.cpu.usage.usermode | container.cpu.usage.usermode | Nanoseconds |
| ecs.task.cpu.usage.system | container.cpu.usage.system | Nanoseconds |
| ecs.task.cpu.usage.vcpu | container.cpu.usage.vcpu | vCPU |
| ecs.task.cpu.cores | container.cpu.cores | Count |
| ecs.task.cpu.onlines | container.cpu.onlines | Count |
| ecs.task.cpu.reserved | container.cpu.reserved | vCPU |
| ecs.task.cpu.utilized | container.cpu.utilized | Percent |
| ecs.task.network.rate.rx | container.network.rate.rx | Bytes/Second |
| ecs.task.network.rate.tx | container.network.rate.tx | Bytes/Second |
| ecs.task.network.io.usage.rx_bytes | container.network.io.usage.rx_bytes | Bytes |
| ecs.task.network.io.usage.rx_packets | container.network.io.usage.rx_packets | Count |
| ecs.task.network.io.usage.rx_errors | container.network.io.usage.rx_errors | Count |
| ecs.task.network.io.usage.rx_dropped | container.network.io.usage.rx_dropped | Count |
| ecs.task.network.io.usage.tx_bytes | container.network.io.usage.tx_bytes | Bytes |
| ecs.task.network.io.usage.tx_packets | container.network.io.usage.tx_packets | Count |
| ecs.task.network.io.usage.tx_errors | container.network.io.usage.tx_errors | Count |
| ecs.task.network.io.usage.tx_dropped | container.network.io.usage.tx_dropped | Count |
| ecs.task.storage.read_bytes | container.storage.read_bytes | Bytes |
| ecs.task.storage.write_bytes | container.storage.write_bytes | Bytes |
Metrics emitted by this receiver comes with a set of resource attributes. These resource attributes can be converted to metrics labels using appropriate processors/exporters (See Full Configuration Examples section below). Finally, these metrics labels can be set as metrics dimensions while exporting to desired destinations. Check the following table to see available resource attributes for Task and Container level metrics. Container level metrics have three additional attributes than task level metrics.
| Resource Attributes for Task Level Metrics | Resource Attributes for Container Level Metrics |
|---|---|
| aws.ecs.cluster.name | aws.ecs.cluster.name |
| aws.ecs.task.family | aws.ecs.task.family |
| aws.ecs.task.arn | aws.ecs.task.arn |
| aws.ecs.task.id | aws.ecs.task.id |
| aws.ecs.task.revision | aws.ecs.task.revision |
| aws.ecs.service.name | aws.ecs.service.name |
| cloud.availability_zone | cloud.availability_zone |
| cloud.account.id | cloud.account.id |
| cloud.region | cloud.region |
| aws.ecs.task.pull_started_at | aws.ecs.container.started_at |
| aws.ecs.task.pull_stopped_at | aws.ecs.container.finished_at |
| aws.ecs.task.known_status | aws.ecs.container.know_status |
| aws.ecs.launch_type | aws.ecs.launch_type |
| aws.ecs.container.created_at | |
| container.name | |
| container.id | |
| aws.ecs.docker.name | |
| container.image.tag | |
| aws.ecs.container.image.id | |
| aws.ecs.container.exit_code |
This receiver emits 52 unique metrics. Customer may not want to send all of them to destinations. Following sections will show full configuration files for filtering and transforming existing metrics with different processors/exporters.
The following example shows a full configuration to get most useful task level metrics. It uses awsecscontainermetrics receiver to collect all the resource usage metrics from ECS task metadata endpoint. It applies filter processor to select only 8 task-level metrics and update metric names using metricstransform processor. It also renames the resource attributes using resource processor which will be used as metric dimensions in the Amazon CloudWatch awsemf exporter. Finally, it sends the metrics to CloudWatch using awsemf exporter under the /aws/ecs/containerinsights/{ClusterName}/performance namespace where the {ClusterName} placeholder will be replaced with actual cluster name. Check the AWS EMF Exporter documentation to see and explore the metrics in Amazon CloudWatch.
Note: AWS OpenTelemetry Collector has a default configuration backed into it for Container Insights experience which is smiliar to this one. Follow our setup doc to check how to use that default config.
receivers:
  awsecscontainermetrics: # collect 52 metrics

processors:
  filter: # filter metrics
    metrics:
      include:
        match_type: strict
        metric_names: # select only 8 task level metrics out of 52
          - ecs.task.memory.reserved
          - ecs.task.memory.utilized
          - ecs.task.cpu.reserved
          - ecs.task.cpu.utilized
          - ecs.task.network.rate.rx
          - ecs.task.network.rate.tx
          - ecs.task.storage.read_bytes
          - ecs.task.storage.write_bytes
  metricstransform: # update metric names
    transforms:
      - include: ecs.task.memory.utilized
        action: update
        new_name: MemoryUtilized
      - include: ecs.task.memory.reserved
        action: update
        new_name: MemoryReserved
      - include: ecs.task.cpu.utilized
        action: update
        new_name: CpuUtilized
      - include: ecs.task.cpu.reserved
        action: update
        new_name: CpuReserved
      - include: ecs.task.network.rate.rx
        action: update
        new_name: NetworkRxBytes
      - include: ecs.task.network.rate.tx
        action: update
        new_name: NetworkTxBytes
      - include: ecs.task.storage.read_bytes
        action: update
        new_name: StorageReadBytes
      - include: ecs.task.storage.write_bytes
        action: update
        new_name: StorageWriteBytes
  resource:
    attributes: # rename resource attributes which will be used as dimensions
      - key: ClusterName
        from_attribute: aws.ecs.cluster.name
        action: insert
      - key: aws.ecs.cluster.name
        action: delete
      - key: ServiceName
        from_attribute: aws.ecs.service.name
        action: insert
      - key: aws.ecs.service.name
        action: delete
      - key: TaskId
        from_attribute: aws.ecs.task.id
        action: insert
      - key: aws.ecs.task.id
        action: delete
      - key: TaskDefinitionFamily
        from_attribute: aws.ecs.task.family
        action: insert
      - key: aws.ecs.task.family
        action: delete
exporters:
  awsemf:
    namespace: ECS/ContainerInsights
    log_group_name: '/aws/ecs/containerinsights/{ClusterName}/performance'
    log_stream_name: '{TaskId}'  # TaskId placeholder will be replaced with actual value
    resource_to_telemetry_conversion:
      enabled: true
    dimension_rollup_option: NoDimensionRollup
    metric_declarations:
      dimensions: [ [ ClusterName ], [ ClusterName, TaskDefinitionFamily ] ]
      metric_name_selectors: [ . ]
service:
  pipelines:
    metrics:
      receivers: [awsecscontainermetrics ]
      processors: [filter, metricstransform, resource]
      exporters: [ awsemf ]
The following example shows a full configuration to get most useful task- and container-level metrics. It uses awsecscontainermetrics receiver to collect all the resource usage metrics from ECS task metadata endpoint. It applies filter processor to select only 8 task- and container-level metrics and update metric names using metricstransform processor. It also renames the resource attributes using resource processor which will be used as metric dimensions in the Amazon CloudWatch awsemf exporter. Finally, it sends the metrics to CloudWatch using awsemf exporter under the /aws/ecs/containerinsights/{ClusterName}/performance namespace where the {ClusterName} placeholder will be replaced with actual cluster name. Check the AWS EMF Exporter documentation to see and explore the metrics in Amazon CloudWatch.
receivers:
    awsecscontainermetrics:

processors:
    filter:
        metrics:
            include:
                match_type: regexp
                metric_names:
                    - .*memory.reserved
                    - .*memory.utilized
                    - .*cpu.reserved
                    - .*cpu.utilized
                    - .*network.rate.rx
                    - .*network.rate.tx
                    - .*storage.read_bytes
                    - .*storage.write_bytes
    metricstransform:
        transforms:
            - include: ecs.task.memory.utilized
              action: update
              new_name: MemoryUtilized
            - include: ecs.task.memory.reserved
              action: update
              new_name: MemoryReserved
            - include: ecs.task.cpu.utilized
              action: update
              new_name: CpuUtilized
            - include: ecs.task.cpu.reserved
              action: update
              new_name: CpuReserved
            - include: ecs.task.network.rate.rx
              action: update
              new_name: NetworkRxBytes
            - include: ecs.task.network.rate.tx
              action: update
              new_name: NetworkTxBytes
            - include: ecs.task.storage.read_bytes
              action: update
              new_name: StorageReadBytes
            - include: ecs.task.storage.write_bytes
              action: update
              new_name: StorageWriteBytes
    resource:
        attributes:
            - key: ClusterName
              from_attribute: aws.ecs.cluster.name
              action: insert
            - key: aws.ecs.cluster.name
              action: delete
            - key: ServiceName
              from_attribute: aws.ecs.service.name
              action: insert
            - key: aws.ecs.service.name
              action: delete
            - key: TaskId
              from_attribute: aws.ecs.task.id
              action: insert
            - key: aws.ecs.task.id
              action: delete
            - key: TaskDefinitionFamily
              from_attribute: aws.ecs.task.family
              action: insert
            - key: aws.ecs.task.family
              action: delete
            - key: ContainerName
              from_attribute: container.name
              action: insert
            - key: container.name
              action: delete
exporters:
    awsemf:
        namespace: ECS/ContainerInsights
        log_group_name:  '/aws/ecs/containerinsights/{ClusterName}/performance'
        log_stream_name: '{TaskId}'
        resource_to_telemetry_conversion:
            enabled: true
        dimension_rollup_option: NoDimensionRollup
        metric_declarations:
            - dimensions: [[ClusterName], [ClusterName, TaskDefinitionFamily]]
              metric_name_selectors:
                - MemoryUtilized
                - MemoryReserved
                - CpuUtilized
                - CpuReserved
                - NetworkRxBytes
                - NetworkTxBytes
                - StorageReadBytes
                - StorageWriteBytes
            - dimensions: [[ClusterName], [ClusterName, TaskDefinitionFamily, ContainerName]]
              metric_name_selectors: [container.*]

service:
    pipelines:
        metrics:
            receivers: [awsecscontainermetrics]
            processors: [filter, metricstransform, resource]
            exporters: [awsemf]
FAQs
Unknown package
Did you know?

Socket for GitHub automatically highlights issues in each pull request and monitors the health of all your open source dependencies. Discover the contents of your packages and block harmful activity before you install or update your dependencies.

Security News
Snyk's use of malicious npm packages for research raises ethical concerns, highlighting risks in public deployment, data exfiltration, and unauthorized testing.

Research
Security News
Socket researchers found several malicious npm packages typosquatting Chalk and Chokidar, targeting Node.js developers with kill switches and data theft.

Security News
pnpm 10 blocks lifecycle scripts by default to improve security, addressing supply chain attack risks but sparking debate over compatibility and workflow changes.