Security News
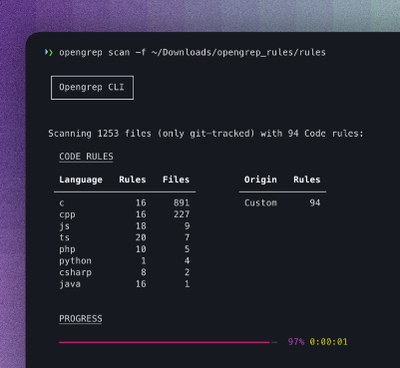
Opengrep Emerges as Open Source Alternative Amid Semgrep Licensing Controversy
Opengrep forks Semgrep to preserve open source SAST in response to controversial licensing changes.
github.com/slok/go-http-metrics
go-http-metrics knows how to measure http metrics in different metric formats and Go HTTP framework/libs. The metrics measured are based on RED and/or Four golden signals, follow standards and try to be measured in a efficient way.
The metrics obtained with this middleware are the most important ones for a HTTP service.
go-http-metrics is easy to extend to different metric backends by implementing metrics.Recorder interface.
The middleware is mainly focused to be compatible with Go std library using http.Handler, but it comes with helpers to get middlewares for other frameworks or libraries.
When go-http-metrics is imported as a dependency, it will only import the libraries being used, this is safe because each lib/framework is in its own package. More information here and here
It supports any framework that supports http.Handler provider type middleware func(http.Handler) http.Handler (e.g Chi, Alice, Gorilla...). Use std.HandlerProvider
A simple example that uses Prometheus as the recorder with the standard Go handler.
package main

import (
    "log"
    "net/http"

    "github.com/prometheus/client_golang/prometheus/promhttp"
    metrics "github.com/slok/go-http-metrics/metrics/prometheus"
    "github.com/slok/go-http-metrics/middleware"
    middlewarestd "github.com/slok/go-http-metrics/middleware/std"
)

func main() {
    // Create our middleware.
    mdlw := middleware.New(middleware.Config{
        Recorder: metrics.NewRecorder(metrics.Config{}),
    })

    // Our handler.
    h := http.HandlerFunc(func(w http.ResponseWriter, r *http.Request) {
        w.WriteHeader(http.StatusOK)
        w.Write([]byte("hello world!"))
    })
    h = middlewarestd.Handler("", mdlw, h)

    // Serve metrics.
    log.Printf("serving metrics at: %s", ":9090")
    go http.ListenAndServe(":9090", promhttp.Handler())

    // Serve our handler.
    log.Printf("listening at: %s", ":8080")
    if err := http.ListenAndServe(":8080", h); err != nil {
        log.Panicf("error while serving: %s", err)
    }
}
For more examples check the examples. default and custom are the examples for Go net/http std library users.
Get the request rate by handler:
sum(
    rate(http_request_duration_seconds_count[30s])
) by (handler)
Get the request error rate:
rate(http_request_duration_seconds_count{code=~"5.."}[30s])
Get percentile 99 of the whole service:
histogram_quantile(0.99,
    rate(http_request_duration_seconds_bucket[5m]))
Get percentile 90 of each handler:
histogram_quantile(0.9,
    sum(
        rate(http_request_duration_seconds_bucket[10m])
    ) by (handler, le)
)
The factory options are the ones that are passed in the moment of creating the middleware factory using the middleware.Config object.
This is the implementation of the metrics backend, by default it's a dummy recorder.
This is an optional argument that can be used to set a specific service on all the middleware metrics, this is helpful when the service uses multiple middlewares on the same app, for example for the HTTP api server and the metrics server. This also gives the ability to use the same recorder with different middlewares.
Storing all the status codes could increase the cardinality of the metrics, usually this is not a common case because the used status codes by a service are not too much and are finite, but some services use a lot of different status codes, grouping the status on the \dxx form could impact the performance (in a good way) of the queries on Prometheus (as they are already aggregated), on the other hand it losses detail. For example the metrics code code="401", code="404", code="403" with this enabled option would end being code="4xx" label. By default is disabled.
This setting will disable measuring the size of the responses. By default measuring the size is enabled.
This settings will disable measuring the number of requests being handled concurrently by the handlers.
This setting is a list of paths that will not be measured for the request duration and the response size. They will still be counted in the RequestsInflight metric.
One of the options that you need to pass when wrapping the handler with the middleware is handlerID, this has 2 working ways.
If an empty string is passed mdwr.Handler("", h) it will get the handler label from the url path. This will create very high cardnialty on the metrics because /p/123/dashboard/1, /p/123/dashboard/2 and /p/9821/dashboard/1 would have different handler labels. This method is only recomended when the URLs are fixed (not dynamic or don't have parameters on the path).
If a predefined handler ID is passed, mdwr.Handler("/p/:userID/dashboard/:page", h) this will keep cardinality low because /p/123/dashboard/1, /p/123/dashboard/2 and /p/9821/dashboard/1 would have the same handler label on the metrics.
There are different parameters to set up your middleware factory, you can check everything on the docs and see the usage in the examples.
This option will make exposed metrics have a {PREFIX}_ in fornt of the metric. For example if a regular exposed metric is http_request_duration_seconds_count and I use Prefix: batman my exposed metric will be batman_http_request_duration_seconds_count. By default this will be disabled or empty, but can be useful if all the metrics of the app are prefixed with the app name.
DurationBuckets are the buckets used for the request duration histogram metric, by default it will use Prometheus defaults, this is from 5ms to 10s, on a regular HTTP service this is very common and in most cases this default works perfect, but on some cases where the latency is very low or very high due the nature of the service, this could be changed to measure a different range of time. Example, from 500ms to 320s Buckets: []float64{.5, 1, 2.5, 5, 10, 20, 40, 80, 160, 320}. Is not adviced to use more than 10 buckets.
This works the same as the DurationBuckets but for the metric that measures the size of the responses. It's measured in bytes and by default goes from 1B to 1GB.
The Prometheus registry to use, by default it will use Prometheus global registry (the default one on Prometheus library).
The label names of the Prometheus metrics can be configured using HandlerIDLabel, StatusCodeLabel, MethodLabel...
Same option as the Prometheus recorder.
Same option as the Prometheus recorder.
Same options as the Prometheus recorder.
This Option is used to unregister the Recorder views before are being registered, this is option is mainly due to the nature of OpenCensus implementation and the huge usage fo global state making impossible to run multiple tests. On regular usage of the library this setting is very rare that needs to be used.
FAQs
Unknown package
Did you know?

Socket for GitHub automatically highlights issues in each pull request and monitors the health of all your open source dependencies. Discover the contents of your packages and block harmful activity before you install or update your dependencies.

Security News
Opengrep forks Semgrep to preserve open source SAST in response to controversial licensing changes.

Security News
Critics call the Node.js EOL CVE a misuse of the system, sparking debate over CVE standards and the growing noise in vulnerability databases.

Security News
cURL and Go security teams are publicly rejecting CVSS as flawed for assessing vulnerabilities and are calling for more accurate, context-aware approaches.