Security News
PodRocket Podcast: Inside the Recent npm Supply Chain Attacks
Socket CEO Feross Aboukhadijeh discusses the recent npm supply chain attacks on PodRocket, covering novel attack vectors and how developers can protect themselves.
@antv/calendar-heatmap
Advanced tools
@antv/calendar-heatmap
The Calendar heatmap implemented by G2.


详见 demo
| 参数名 | 说明 | 必填 | 类型 | 默认值 | 备注 |
|---|---|---|---|---|---|
| autoFit | 是否自适应宽高,默认为 true | 否 | boolean | true | - |
| partition | 是否按月为单位分区绘制 | 否 | boolean | false | - |
| width | 图表宽度 | 否 | number | - | - |
| height | 图表高度 | 否 | number | - | - |
| data | 绘制数据 | 是 | object[] | - | - |
| dateField | 数据中代表时间的字段 | 是 | string | - | - |
| valueField | 数据中需要可视化的数值字段 | 是 | string | - | - |
| colors | 颜色映射 | 否 | string[] | - | - |
| condition | 颜色映射条件 | 否 | Function | - | 当声明 condition 时,必须同时声明 colors |
| squareStyle | 方块的样式 | 否 | object | - | - |
| size | 方块的大小 | 否 | number | 16 | - |
| axis | 坐标轴样式 | 否 | object | - | 可配置属性: 1. visible 是否展示2. tickCount 刻度数量3. style 文本样式 |
| title | 图表各个月份的标题配置 | 否 | object | - | 可配置属性: 1. visible 是否展示2. style 文本样式 |
| start | 开始月份 | 否 | string | - | 声明日历开始的月份,格式必须为 'YYYY-MM',无论用户数据中是否有该月份的值,都会以 start 为准 |
| end | 结束月份 | 否 | string | - | 声明日历结束的月份,格式必须为 'YYYY-MM',无论用户数据中是否有该月份的值,都会以 start 为准 |
标准的 JSON 数组,每条记录需要包含 'YYYY-MM-DD' 的日期以及数值字段。
如下所示:
[
  { date: '2017-06-01', commits: 20 },
  { date: '2017-06-02', commits: 0 },
  { date: '2017-06-03', commits: 1 },
  { date: '2017-05-16', commits: 18 },
  { date: '2017-10-16', commits: 4 },
];
几点说明:
2017-06-01 ~ 2019-06-30 每一天的数据补齐,用户无需自己处理start 和 end 属性
import React, { Component } from 'react';
import ReactDOM from 'react-dom';
import CalendarHeatmap from '@antv/calendar-heatmap';

class App extends Component {
  render() {
    const data = [
      { date: '2017-06-01', commits: 20 },
      { date: '2017-06-02', commits: 0 },
      { date: '2017-06-03', commits: 1 },
      { date: '2017-05-16', commits: 18 },
      { date: '2017-10-16', commits: 4 },
    ];

    const chartCfg = {
      start: '2016-10',
      end: '2017-10',
      data,
      height: 180,
      size: 10,
      dateField: 'date',
      valueField: 'commits',
      condition: val => {
        if (val === 0) {
          return '#F2F3F5';
        }

        if (val > 0 && val <= 1) {
          return '#BAE7FF';
        }

        if (val > 1 && val <= 10) {
          return '#1890FF';
        }

        if (val > 10) {
          return '#0050B3';
        }
      },
    };
    return (
      <div>
        <CalendarHeatmap {...chartCfg} />
      </div>
    );
  }
}

ReactDOM.render(<App />, mountNode);
FAQs
The Calendar heatmap implemented by G2.
We found that @antv/calendar-heatmap demonstrated a not healthy version release cadence and project activity because the last version was released a year ago. It has 27 open source maintainers collaborating on the project.
Did you know?

Socket for GitHub automatically highlights issues in each pull request and monitors the health of all your open source dependencies. Discover the contents of your packages and block harmful activity before you install or update your dependencies.

Security News
Socket CEO Feross Aboukhadijeh discusses the recent npm supply chain attacks on PodRocket, covering novel attack vectors and how developers can protect themselves.

Security News
Maintainers back GitHub’s npm security overhaul but raise concerns about CI/CD workflows, enterprise support, and token management.

Product
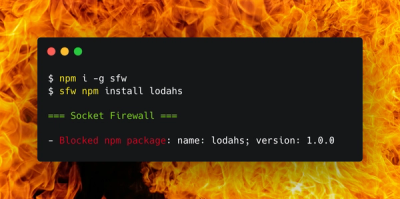
Socket Firewall is a free tool that blocks malicious packages at install time, giving developers proactive protection against rising supply chain attacks.