Security News
Deno 2.2 Improves Dependency Management and Expands Node.js Compatibility
Deno 2.2 enhances Node.js compatibility, improves dependency management, adds OpenTelemetry support, and expands linting and task automation for developers.
@arction/lcjs
Advanced tools
LightningChart JS is a WebGL based, lightning-fast real-time data visualization charting library with a focus on exceptional performance. Performance testing results prove it’s able to visualize streaming data rates no other library for JS can, both in 2D and 3D. The fastest rendering real JavaScript charting library.
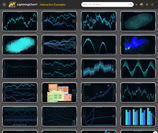
Whether you are first learning about LightningChart, investigating if it suits your needs or starting with your own application development our interactive examples application is the place to start from.
Click here to browse almost all LightningChart JS features, interact with the charts, test the performance and see how the code looks.

|

|

|

|

|

|

|

|

|

|

|

|

|

|

|

|
More interactive examples
Performance comparison:
We have made multiple comparisons of LightningChart® JS against other popular JavaScript charting libraries. Check all of the comparisons and find out how we got the results here
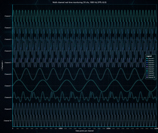
Some performance results, with a typical desktop PC:
Key features:
For latest instructions, please refer to Developer Documentation.
Install the library package from NPM.
npm install --save @arction/lcjs
This package can be used with any bundler that supports CommonJS. Some examples of bundlers that work are WebPack, Parcel and Rollup.
Check our getting started video on LightningChart JS to see this in action.
Any of our Examples can be used as a seed project. All examples on that page have been made to standalone repositories which can be found on our GitHub. Standalone Example Repositories
The library is distributed with a browser ready IIFE bundle. This bundle can be used directly in browsers with script tag. You can see an example implementation of this method in our Developer Documentation
All of our examples can be used in the html page. To use them,
first find an example you want to use from interactive examples.
Click Edit this example. On the bottom of the page click on the button that reads CJS. That will switch our code to be IIFE compatible.
After that, the code can be copied to the html page. See our LightningChart JS html usage example for more detailed information.
LightningChart JS requires a license key to be used. Get one here.
// Using a license key
const lc = lightningChart({ license: 'my-license-key' })
const chart = lc.ChartXY()
For latest instructions, please refer to Developer Documentation.
Terms of use can be found here.
For more materials, instructions, guides and troubleshooting, please refer to the more conclusive Developer Documentation.
FAQs
A high-performance charting library.
The npm package @arction/lcjs receives a total of 1,472 weekly downloads. As such, @arction/lcjs popularity was classified as popular.
We found that @arction/lcjs demonstrated a healthy version release cadence and project activity because the last version was released less than a year ago. It has 0 open source maintainers collaborating on the project.
Did you know?

Socket for GitHub automatically highlights issues in each pull request and monitors the health of all your open source dependencies. Discover the contents of your packages and block harmful activity before you install or update your dependencies.

Security News
Deno 2.2 enhances Node.js compatibility, improves dependency management, adds OpenTelemetry support, and expands linting and task automation for developers.

Security News
React's CRA deprecation announcement sparked community criticism over framework recommendations, leading to quick updates acknowledging build tools like Vite as valid alternatives.

Security News
Ransomware payment rates hit an all-time low in 2024 as law enforcement crackdowns, stronger defenses, and shifting policies make attacks riskier and less profitable.