Product
Introducing License Enforcement in Socket
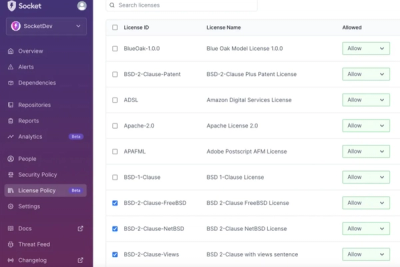
Ensure open-source compliance with Socket’s License Enforcement Beta. Set up your License Policy and secure your software!
By Philipp Burckhardt - Oct 17, 2024
@aws-lambda-powertools/metrics
Advanced tools
The metrics package for the AWS Lambda powertools (TypeScript) library
@aws-lambda-powertools/metrics is an npm package designed to simplify the creation and management of custom metrics in AWS Lambda functions. It provides utilities to easily capture and publish metrics to Amazon CloudWatch, enabling better observability and monitoring of serverless applications.
Creating Custom Metrics
This feature allows you to create custom metrics and publish them to CloudWatch. The code sample demonstrates how to add metrics for successful invocations and processing time, and then publish them.
const { Metrics, MetricUnits } = require('@aws-lambda-powertools/metrics');
const metrics = new Metrics();
exports.handler = async (event) => {
metrics.addMetric('SuccessfulInvocations', MetricUnits.Count, 1);
metrics.addMetric('ProcessingTime', MetricUnits.Milliseconds, 200);
await metrics.publishStoredMetrics();
return { statusCode: 200, body: 'Metrics published' };
};Namespace and Dimensions
This feature allows you to set a namespace and dimensions for your metrics, which helps in organizing and filtering them in CloudWatch. The code sample shows how to set a namespace and dimensions for a payment service.
const { Metrics, MetricUnits } = require('@aws-lambda-powertools/metrics');

const metrics = new Metrics({ namespace: 'MyApp', dimensions: { Service: 'Payment' } });

exports.handler = async (event) => {
  metrics.addMetric('PaymentSuccess', MetricUnits.Count, 1);
  await metrics.publishStoredMetrics();
  return { statusCode: 200, body: 'Payment metrics published' };
};
Automatic Cold Start Metric
This feature automatically captures a cold start metric, which is useful for understanding the performance impact of cold starts in your Lambda functions. The code sample demonstrates how to enable this feature.
const { Metrics, MetricUnits } = require('@aws-lambda-powertools/metrics');

const metrics = new Metrics({ captureColdStartMetric: true });

exports.handler = async (event) => {
  metrics.addMetric('HandlerInvoked', MetricUnits.Count, 1);
  await metrics.publishStoredMetrics();
  return { statusCode: 200, body: 'Cold start metric captured' };
};The aws-sdk package is the official AWS SDK for JavaScript, which includes support for CloudWatch metrics. However, it requires more boilerplate code to achieve the same functionality as @aws-lambda-powertools/metrics. It is more general-purpose and not specifically tailored for Lambda functions.
The cloudwatch-metrics package is a lightweight library for publishing metrics to CloudWatch. It provides a simpler interface compared to the aws-sdk but lacks some of the advanced features and integrations offered by @aws-lambda-powertools/metrics, such as automatic cold start metrics.
Metricsnpm run test
npm run example:hello-world
npm run example:constructor-options
npm run example:manual-flushing
npm run example:programatic-access
npm run example:dimensions
npm run example:default-dimensions
npm run example:default-dimensions-constructor
npm run example:empty-metrics
npm run example:single-metric
npm run example:cold-start
Metrics has two global settings that will be used across all metrics emitted:
| Setting | Description | Environment Variable | Constructor Parameter |
|---|---|---|---|
| Metric namespace | Logical container where all metrics will be placed e.g. ServerlessAirline | POWERTOOLS_METRICS_NAMESPACE | namespace |
| Service | Optionally, sets service metric dimension across all metrics e.g. payment | POWERTOOLS_SERVICE_NAME | service |
// Import the library
import { Metrics, MetricUnits } from '../src';
// When going public, it will be something like: import { Metrics, MetricUnits } from '@aws-lambda-powertools/metrics';

process.env.POWERTOOLS_METRICS_NAMESPACE = 'hello-world';
process.env.POWERTOOLS_SERVICE_NAME = 'hello-world-service';

// Instantiate the Logger with default configuration
const metrics = new Metrics();

// Add an example Metric
metrics.addMetric('test-metric', MetricUnits.Count, 10);

//Print resulting data
const metricsObject = metrics.serializeMetrics();
metrics.clearMetrics();
console.log(JSON.stringify(metricsObject));
{
  "_aws":{
  "Timestamp":1625587915573,
  "CloudWatchMetrics":
    [
      {
        "Namespace":"hello-world",
        "Dimensions":[["service"]],
        "Metrics":
          [
            {
              "Name":"test-metric",
              "Unit":"Count"
            }
          ]
      }
    ]
  },
  "service":"hello-world-service",
  "test-metric":10
}
With decorators:
import { Metrics, MetricUnits } from '../src';

process.env.POWERTOOLS_METRICS_NAMESPACE = 'hello-world';
process.env.POWERTOOLS_SERVICE_NAME = 'hello-world-service';

// Instantiate the Logger with default configuration
const metrics = new Metrics();

class Lambda implements LambdaInterface {

  @metrics.logMetrics()
  public handler<TEvent, TResult>(_event: TEvent, _context: Context, _callback: Callback<TResult>): void | Promise<TResult> {
    metrics.addDimension('OuterDimension', 'true');
    metrics.addMetric('test-metric', MetricUnits.Count, 10);
  }

}
By default the cold start metric is not captured, it can however be enabled using a parameter passed to the logMetrics decorator
import { Metrics, MetricUnits } from '../src';

process.env.POWERTOOLS_METRICS_NAMESPACE = 'hello-world';
process.env.POWERTOOLS_SERVICE_NAME = 'hello-world-service';

// Instantiate the Logger with default configuration
const metrics = new Metrics();

class Lambda implements LambdaInterface {

  @metrics.logMetrics({ captureColdStartMetric: true })
  public handler<TEvent, TResult>(_event: TEvent, _context: Context, _callback: Callback<TResult>): void | Promise<TResult> {
    metrics.addMetric('test-metric', MetricUnits.Count, 10);
  }

}
{
  "_aws":{
  "Timestamp":1625587915572,
  "CloudWatchMetrics":
    [
      {
        "Namespace":"hello-world",
        "Dimensions":[[
          "service","function_name"
        ]],
        "Metrics":
          [
            {
              "Name":"ColdStart",
              "Unit":"Count"
            }
          ]
      }
    ]
  },
  "service":"hello-world-service",
  "function_name":"foo-bar-function",
  "ColdStart":1
}
{
  "_aws":{
  "Timestamp":1625587915573,
  "CloudWatchMetrics":
    [
      {
        "Namespace":"hello-world",
        "Dimensions":[["service"]],
        "Metrics":
          [
            {
              "Name":"test-metric",
              "Unit":"Count"
            }
          ]
      }
    ]
  },
  "service":"hello-world-service",
  "test-metric":10
}
Please note, we do not emit a 0 value for the ColdStart metric, for cost reasons
If it's a cold start invocation, this feature will:
This has the advantage of keeping cold start metric separate from your application metrics, where you might have unrelated dimensions.
You can create metrics using addMetric, and you can create dimensions for all your aggregate metrics using addDimension method.
import { Metrics, MetricUnits } from '../src';

process.env.POWERTOOLS_METRICS_NAMESPACE = 'hello-world';
process.env.POWERTOOLS_SERVICE_NAME = 'hello-world-service';

// Instantiate the Logger with default configuration
const metrics = new Metrics();

class Lambda implements LambdaInterface {

  @metrics.logMetrics({ captureColdStartMetric: true })
  public handler<TEvent, TResult>(_event: TEvent, _context: Context, _callback: Callback<TResult>): void | Promise<TResult> {
    metrics.addDimension('OuterDimension', 'true'); //Optional -  add custom dimensions
    metrics.addMetric('test-metric', MetricUnits.Count, 10);
  }

}
{
  "_aws":{
  "Timestamp":1625587915572,
  "CloudWatchMetrics":
    [
      {
        "Namespace":"hello-world",
        "Dimensions":[[
          "service",
          "OuterDimension"
        ]],
        "Metrics":
          [
            {
              "Name":"test-metric",
              "Unit":"Count"
            }
          ]
      }
    ]
  },
  "OuterDimension": "true",
  "service":"hello-world-service",
  "test-metric": 10
}
Autocomplete Metric Units
MetricUnits will facilitate finding a supported metric unit by CloudWatch. Alternatively, you can pass the value as a string if you already know them e.g. "Count".
Metrics Overflow
CloudWatch EMF supports a max of 100 metrics per batch. Metrics utility will flush all metrics when adding the 100th metric. Subsequent metrics, e.g. 101th, will be aggregated into a new EMF object, for your convenience.
! Do not create metrics or dimensions outside the handler
Metrics or dimensions added in the global scope will only be added during cold start. Disregard if that's the intended behaviour.
You can use either setDefaultDimensions method or by passing a defaultDimensions object to either the decorator or to the constructor
If you'd like to remove them at some point, you can use clearDefaultDimensions method.
import { Metrics, MetricUnits } from '../src';

const metrics = new Metrics();
metrics.setDefaultDimensions({ 'application': 'hello-world' });
class Lambda implements LambdaInterface {
  @metrics.logMetrics()
  public handler<TEvent, TResult>(_event: TEvent, _context: Context, _callback: Callback<TResult>): void | Promise<TResult> {
    metrics.addMetric('new-test-metric', MetricUnits.Count, 5);
  }

}
With decorators:
import { Metrics, MetricUnits } from '../src';

const metrics = new Metrics();

class Lambda implements LambdaInterface {
  @metrics.logMetrics({ defaultDimensions:{ 'application': 'hello-world' } })
  public handler<TEvent, TResult>(_event: TEvent, _context: Context, _callback: Callback<TResult>): void | Promise<TResult> {
    metrics.addMetric('new-test-metric', MetricUnits.Count, 5);
  }

}
{
  "_aws":{
  "Timestamp":1625587915572,
  "CloudWatchMetrics":
    [
      {
        "Namespace":"hello-world",
        "Dimensions":[[
          "application"
        ]],
        "Metrics":
          [
            {
              "Name":"new-test-metric",
              "Unit":"Count"
            }
          ]
      }
    ]
  },
  "application":"hello-world",
  "new-test-metric": 5
}
As you finish adding all your metrics, you need to serialize and flush them to standard output. You can do that automatically with the logMetrics decorator.
This decorator also serializes, and flushes all your metrics. During metrics validation, if no metrics are provided then a warning will be logged, but no exception will be raised.
class Lambda implements LambdaInterface {

  @metrics.logMetrics()
  public handler<TEvent, TResult>(_event: TEvent, _context: Context, _callback: Callback<TResult>): void | Promise<TResult> {
    metrics.addMetric('test-metric', MetricUnits.Count, 10);

  }

}
If you need to log the metrics from within your code or if you do not wish to use the decorator, you can do this by calling the purgeStoredMetrics method.
This will serialize, and flush all your metrics.
process.env.POWERTOOLS_METRICS_NAMESPACE = 'hello-world';
process.env.POWERTOOLS_SERVICE_NAME = 'hello-world-service';
const metrics = new Metrics();

const lambdaHandler: Handler = async () => {

  metrics.addMetric('test-metric', MetricUnits.Count, 10);
  const metricsObject = metrics.serializeMetrics();
  metrics.purgeStoredMetrics();
  console.log(JSON.stringify(metricsObject));

  return {
    foo: 'bar'
  };

};
{
  "_aws":{
  "Timestamp":1625587915573,
  "CloudWatchMetrics":
    [
      {
        "Namespace":"hello-world",
        "Dimensions":[["service"]],
        "Metrics":
          [
            {
              "Name":"test-metric",
              "Unit":"Count"
            }
          ]
      }
    ]
  },
  "service":"hello-world-service",
  "test-metric":10
}
If you just need to clear the metrics manually you can do this by calling the clearMetrics method
class Lambda implements LambdaInterface {

  @metrics.logMetrics()
  public handler<TEvent, TResult>(_event: TEvent, _context: Context, _callback: Callback<TResult>): void | Promise<TResult> {
    metrics.addMetric('test-metric', MetricUnits.Count, 10);
    metrics.clearMetrics();

  }

}
If you need to get programmatic access to the current stored metrics you can do this by calling the serializeMetrics method.
This will not clear any metrics that are currently stored, if you need to do this, you can use the clearMetrics method as described above.
process.env.POWERTOOLS_METRICS_NAMESPACE = 'hello-world';
process.env.POWERTOOLS_SERVICE_NAME = 'hello-world-service';
class Lambda implements LambdaInterface {
  @metrics.logMetrics()
  public handler<TEvent, TResult>(_event: TEvent, _context: Context, _callback: Callback<TResult>): void | Promise<TResult> {
    metrics.addMetric('test-metric', MetricUnits.Count, 15);
    const metricsObject = metrics.serializeMetrics();
    console.log(JSON.stringify(metricsObject));
  }

}
{
  "_aws":{
  "Timestamp":1625587915573,
  "CloudWatchMetrics":
    [
      {
        "Namespace":"hello-world",
        "Dimensions":[["service"]],
        "Metrics":
          [
            {
              "Name":"test-metric",
              "Unit":"Count"
            }
          ]
      }
    ]
  },
  "service":"hello-world-service",
  "test-metric":15
}
If you want to ensure that at least one metric is emitted, you can pass raiseOnEmptyMetrics to the logMetrics decorator:
class Lambda implements LambdaInterface {

  @metrics.logMetrics({raiseOnEmptyMetrics: true})
  public handler<TEvent, TResult>(_event: TEvent, _context: Context, _callback: Callback<TResult>): void | Promise<TResult> {
    // This will throw an error unless at least one metric is added
  }

}
You can add high-cardinality data as part of your Metrics log with addMetadata method. This is useful when you want to search highly contextual information along with your metrics in your logs.
Info
This will not be available during metrics visualization - Use dimensions for this purpose
class Lambda implements LambdaInterface {

  @metrics.logMetrics()
  metrics.addMetadata('metadata_name', 'metadata_value')
  public handler<TEvent, TResult>(_event: TEvent, _context: Context, _callback: Callback<TResult>): void | Promise<TResult> {
    //Your Logic
  }

}
CloudWatch EMF uses the same dimensions across all your metrics. Use the singleMetric method if you have a metric that should have different dimensions.
class Lambda implements LambdaInterface {

  @metrics.logMetrics()
  public handler<TEvent, TResult>(_event: TEvent, _context: Context, _callback: Callback<TResult>): void | Promise<TResult> {
    const singleMetric = metrics.singleMetric();
    metrics.addDimension('OuterDimension', 'true');
    singleMetric.addDimension('InnerDimension', 'true');
    metrics.addMetric('test-metric', MetricUnits.Count, 10);
    singleMetric.addMetric('single-metric', MetricUnits.Percent, 50);
  }

}
Info
Generally, this would be an edge case since you pay for unique metric. Keep the following formula in mind:
unique metric = (metric_name + dimension_name + dimension_value)
FAQs
The metrics package for the Powertools for AWS Lambda (TypeScript) library
The npm package @aws-lambda-powertools/metrics receives a total of 120,463 weekly downloads. As such, @aws-lambda-powertools/metrics popularity was classified as popular.
We found that @aws-lambda-powertools/metrics demonstrated a healthy version release cadence and project activity because the last version was released less than a year ago. It has 0 open source maintainers collaborating on the project.
Did you know?

Socket for GitHub automatically highlights issues in each pull request and monitors the health of all your open source dependencies. Discover the contents of your packages and block harmful activity before you install or update your dependencies.
Product
Ensure open-source compliance with Socket’s License Enforcement Beta. Set up your License Policy and secure your software!
Product
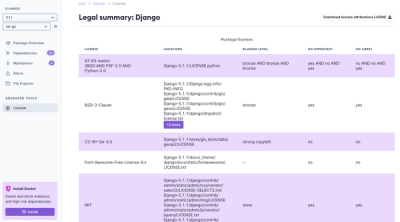
We're launching a new set of license analysis and compliance features for analyzing, managing, and complying with licenses across a range of supported languages and ecosystems.
Product
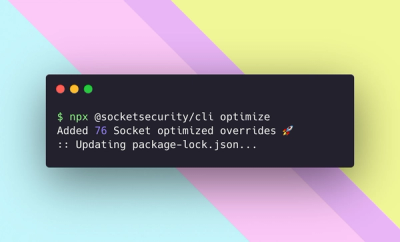
We're excited to introduce Socket Optimize, a powerful CLI command to secure open source dependencies with tested, optimized package overrides.