Security News
Node.js EOL Versions CVE Dubbed the "Worst CVE of the Year" by Security Experts
Critics call the Node.js EOL CVE a misuse of the system, sparking debate over CVE standards and the growing noise in vulnerability databases.
@glideapps/glide-data-grid
Advanced tools
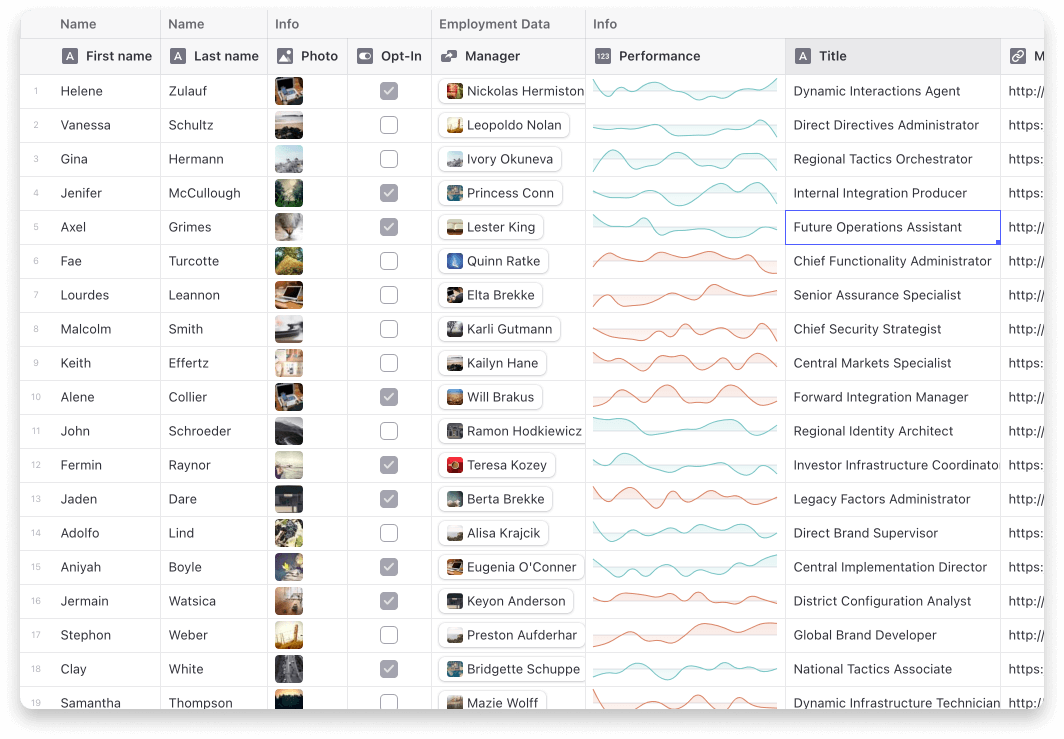
A relatively small HTML5 Canvas based data editor supporting millions of rows, rapid updating, and fully native scrolling. We built Data Grid as the basis for the Glide Data Editor.

Lot's of fun examples are in our Storybook
First make sure you are using React 16 or greater. Then install the data grid:
npm i @glideapps/glide-data-grid
You may also need to install the peer dependencies if you don't have them already:
npm i lodash marked react-responsive-carousel styled-components
Create a new DataEditor wherever you need to display lots and lots of data
// The container is not required, but is convenient for getting started
<DataEditorContainer width={1000} height={700}>
    <DataEditor getCellContent={getData} columns={columns} rows={numRows} />
</DataEditorContainer>
Making your columns is easy
// Grid columns may also provide icon, overlayIcon, menu, style, and theme overrides
const columns: GridColumn[] = [
    { title: "First Name", width: 100 },
    { title: "Last Name", width: 100 },
];
Last provide data to the grid
// If fetching data is slow you can use the DataEditor ref to send updates for cells
// once data is loaded.
function getData([col, row]: readonly [number, number]): GridCell {
    const person = getData(row);

    if (col === 0) {
        return {
            kind: GridCellKind.Text,
            data: person.firstName,
            allowOverlay: false,
        };
    } else if (col === 1) {
        return {
            kind: GridCellKind.Text,
            data: person.lastName,
            allowOverlay: false,
        };
    } else {
        throw new Error();
    }
}
The full API documentation is in the API.md file.
Nothing shows up!
Please read the Prerequisites section in the docs.
It crashes when I try to edit a cell!
Please read the Prerequisites section in the docs.
Does it work with screen readers and other a11y tools?
Yes. Unfortunately none of the primary developers are accessibility users so there are likely flaws in the implementation we are not aware of. Bug reports welcome!
Does it support my data source?
Yes.
Data Grid is agnostic about the way you load/store/generate/mutate your data. What it requires is that you tell it which columns you have, how many rows, and to give it a function it can call to get the data for a cell in a specific row and column.
Does it do sorting, searching, and filtering?
Search is included. You provide the trigger, we do the search. Example in our storybook.
Filtering and sorting are something you would have to implement with your data source. There are hooks for adding column header menus if you want that.
The reason we don't add filtering/sorting in by default is that these are usually very application-specific, and can often also be implemented more efficiently in the data source, via a database query, for example.
Can it do frozen columns?
Yes!
Can I render my own cells?
Yes, but the renderer has to use HTML Canvas. Simple example in our Storybook.
Why does Data Grid use HTML Canvas?
Originally we had implemented our Grid using virtualized rendering. We virtualized both in the horizontal and vertical direction using react-virtualized. The problem is simply scrolling performance. Once you need to load/unload hundreds of DOM elements per frame nothing can save you.
There are some hacks you can do like setting timers and entering into a "low fidelity" rendering mode where you only render a single element per cell. This works okay until you want to show hundreds of cells and you are right back to choppy scrolling. It also doesn't really look or feel great.
FAQs
React data grid for beautifully displaying and editing large amounts of data with amazing performance.
The npm package @glideapps/glide-data-grid receives a total of 25,259 weekly downloads. As such, @glideapps/glide-data-grid popularity was classified as popular.
We found that @glideapps/glide-data-grid demonstrated a healthy version release cadence and project activity because the last version was released less than a year ago. It has 10 open source maintainers collaborating on the project.
Did you know?

Socket for GitHub automatically highlights issues in each pull request and monitors the health of all your open source dependencies. Discover the contents of your packages and block harmful activity before you install or update your dependencies.

Security News
Critics call the Node.js EOL CVE a misuse of the system, sparking debate over CVE standards and the growing noise in vulnerability databases.

Security News
cURL and Go security teams are publicly rejecting CVSS as flawed for assessing vulnerabilities and are calling for more accurate, context-aware approaches.

Security News
Bun 1.2 enhances its JavaScript runtime with 90% Node.js compatibility, built-in S3 and Postgres support, HTML Imports, and faster, cloud-first performance.