React component for D3.js Calendar Heatmap
This d3.js heatmap representing time series data is used to visualize tracked time over the past year, showing details for each of the days on demand.
Includes a global overview of multiple years and visualizations of year, month, week and day overview with zoom for details-on-demand.
Live Demo.
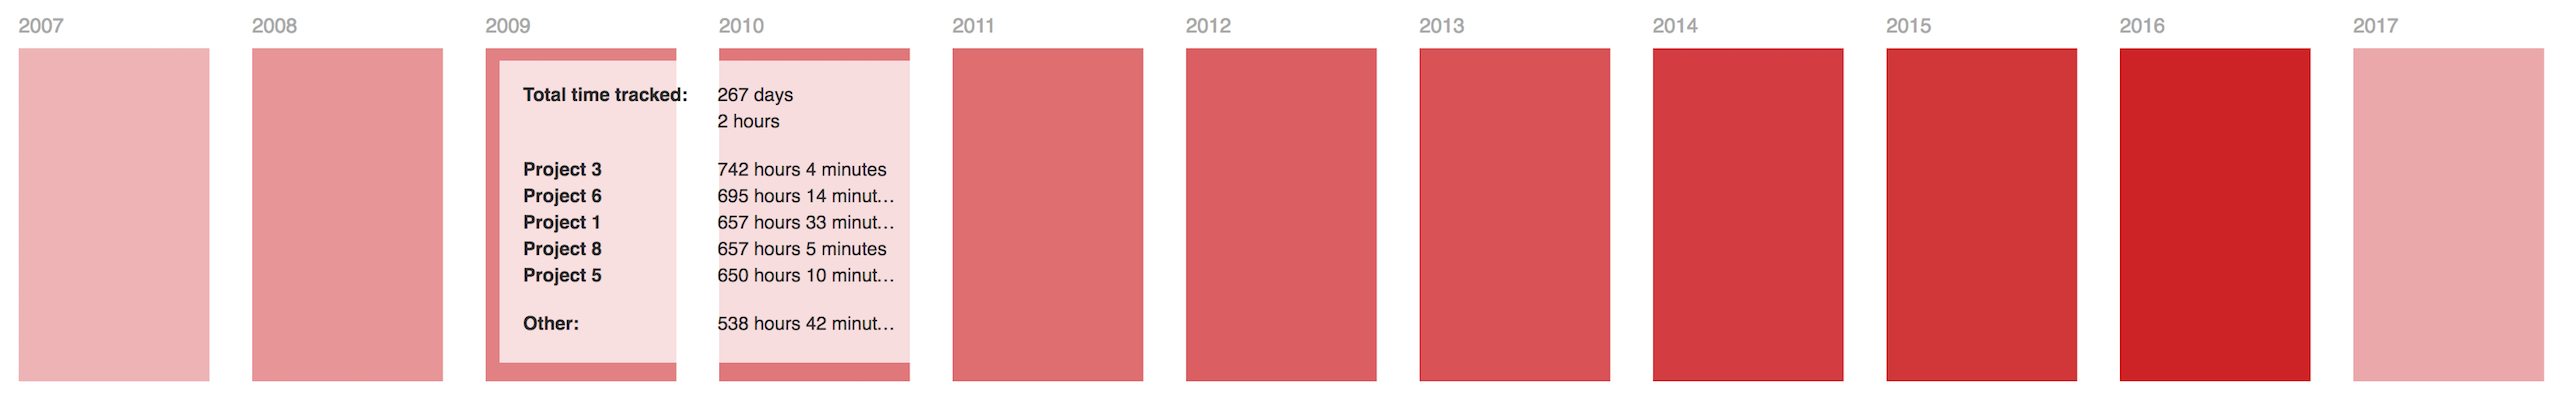
Global overview
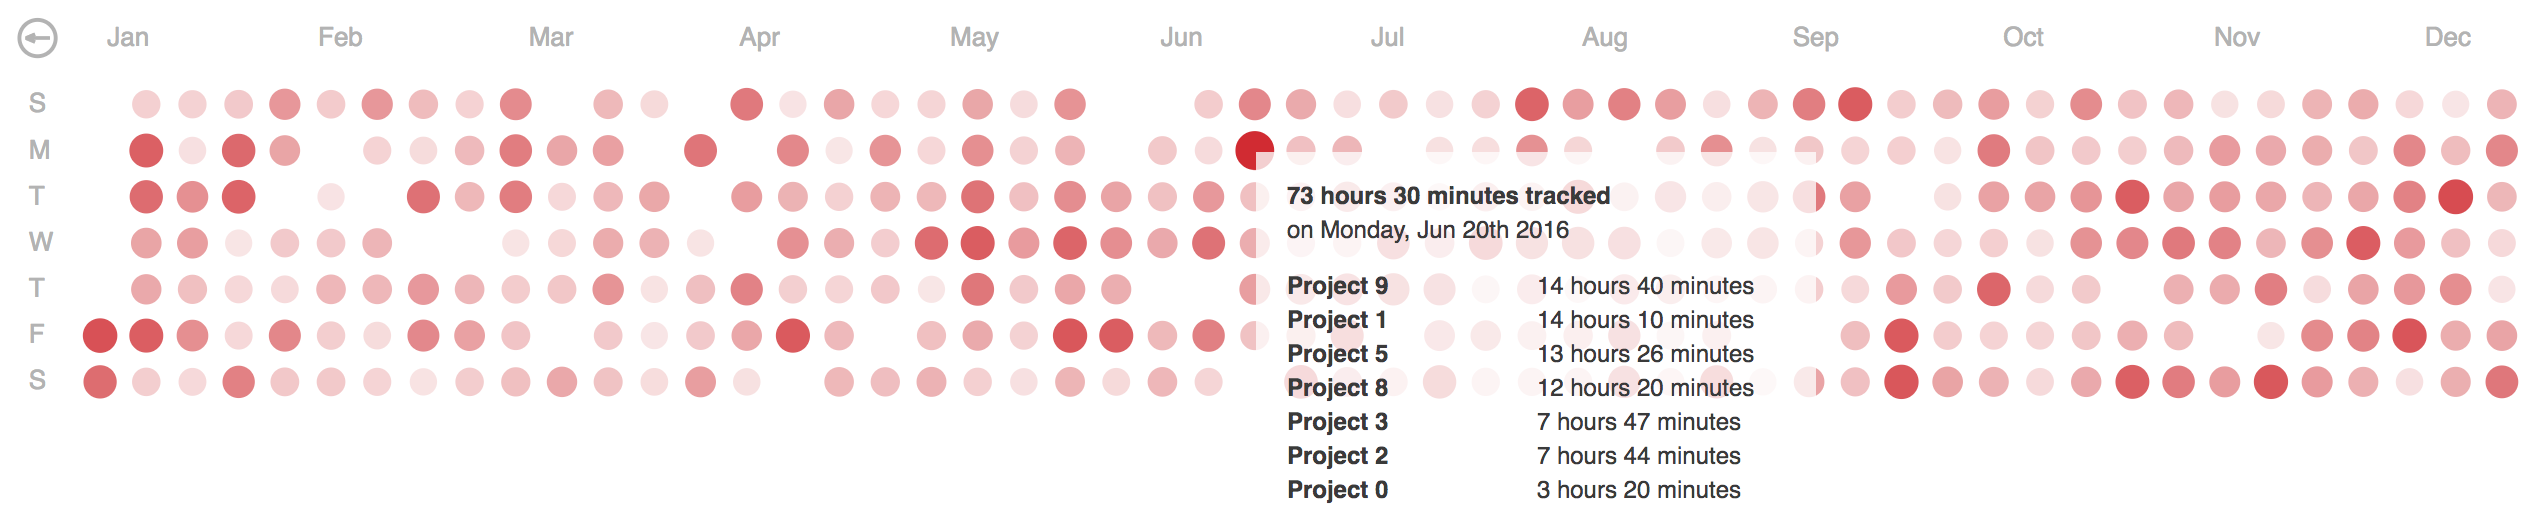
Year overview
Month overview
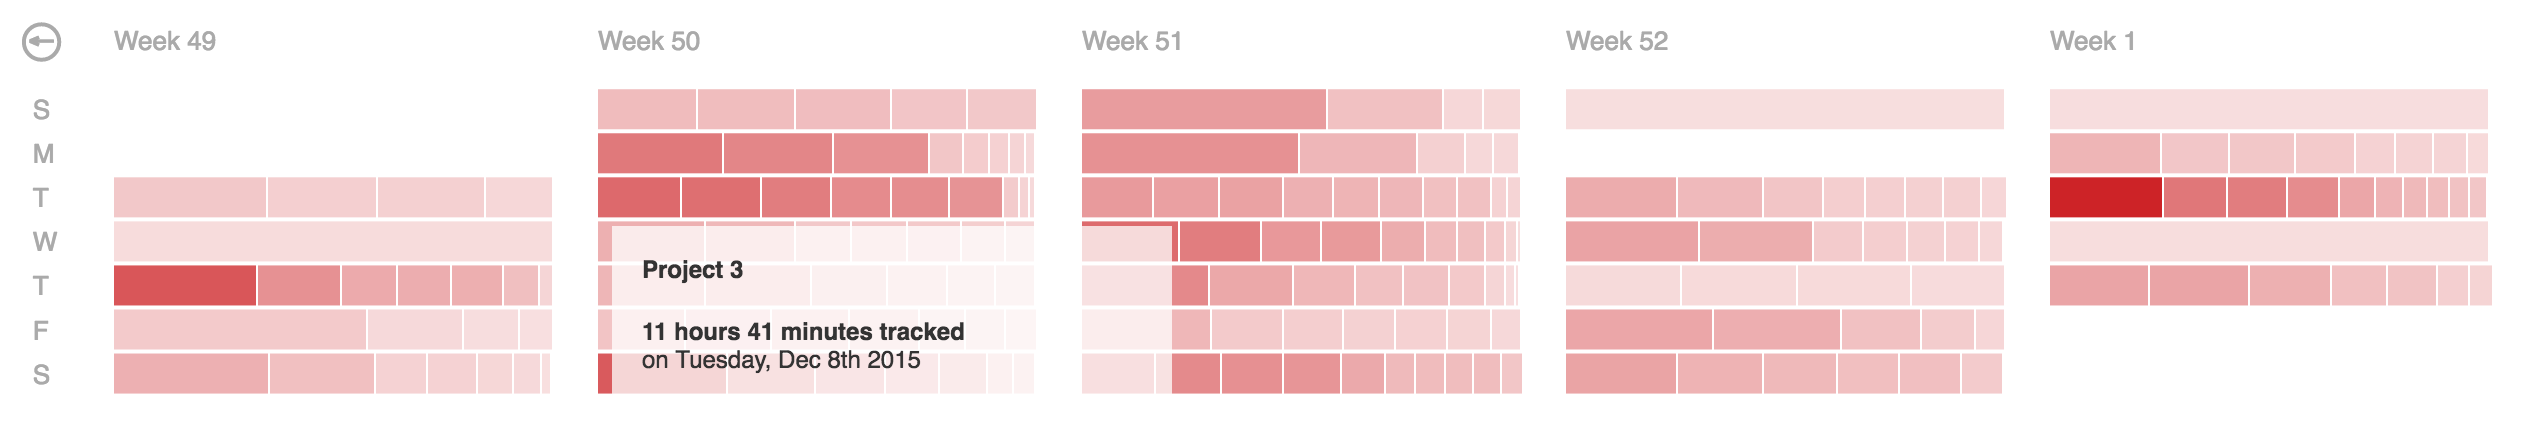
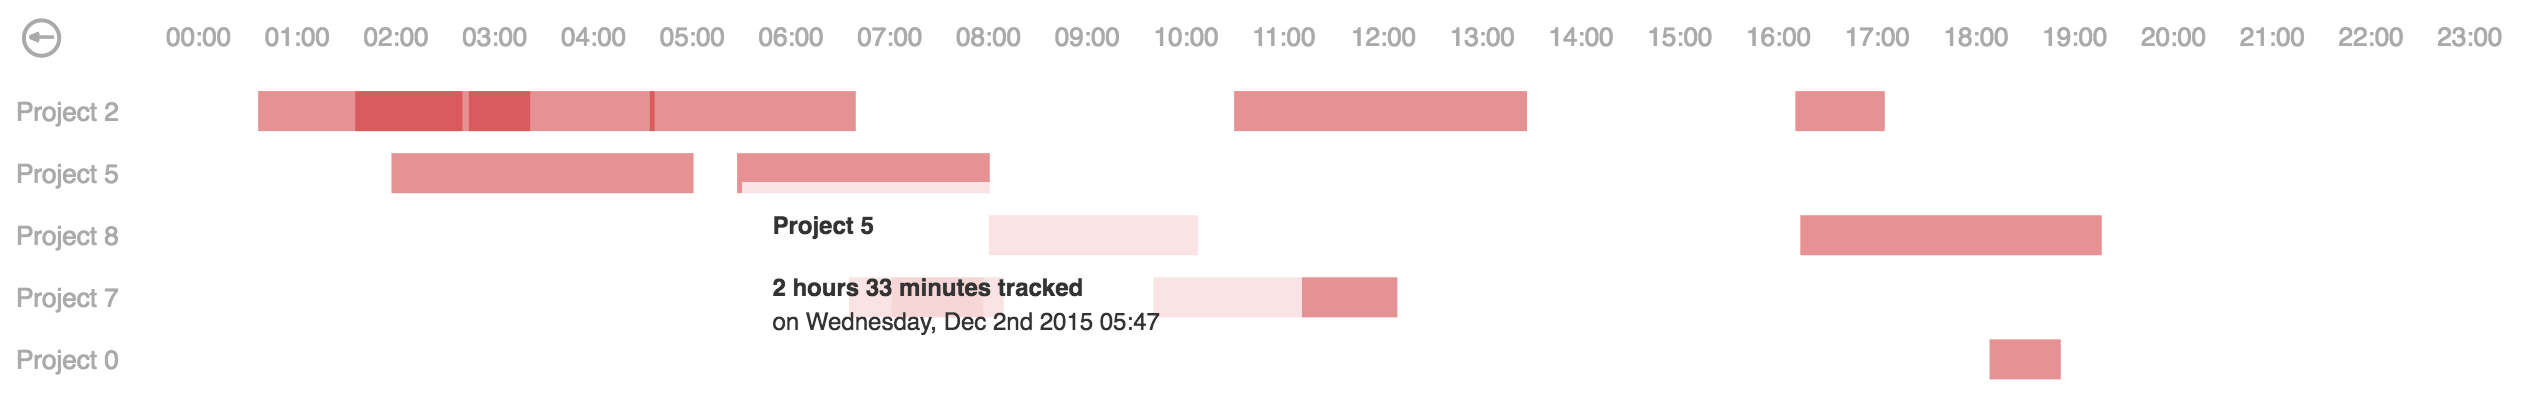
Week overview
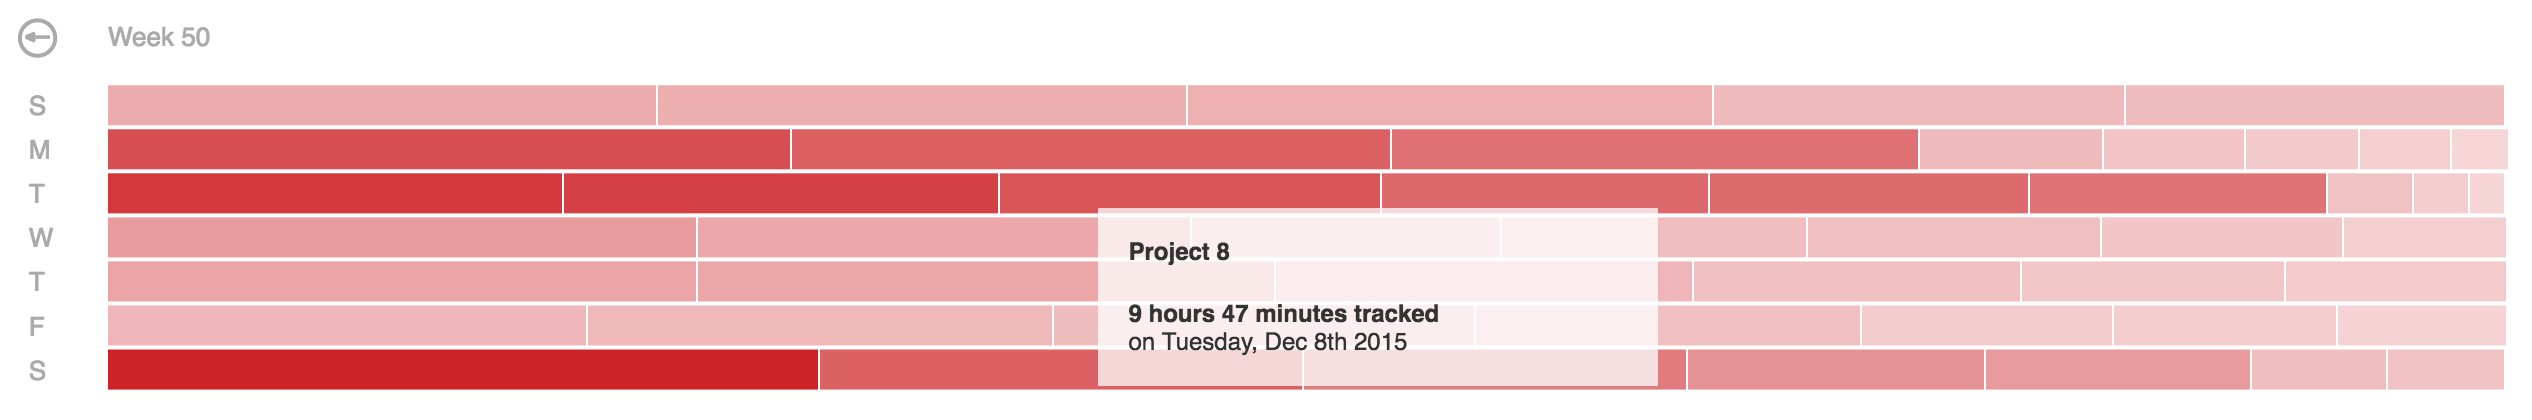
Day overview
Install
- Install
@manufac/reactjs-calendar-heatmap with yarn (or npm):
yarn add @manufac/reactjs-calendar-heatmap
- Import
CalendarHeatmap in your component
import { CalendarHeatmap } from '@manufac/reactjs-calendar-heatmap';
- Render
CalendarHeatmap component
<CalendarHeatmap
  data={data}
  color={color}
  overview={overview}
  handler={print}
  onTooltip={show}
  onHideTooltip={hide}
/>
Interfaces
export interface CalendarHeatmapDetail {
  date: string;
  name: string;
  value: number;
}
interface CalendarHeatmapDatum {
  date: string;
  total: number;
  details: CalendarHeatmapDetail[];
  summary?: { name: string; value: number }[];
}
Properties
| Property | Type | Usage | Default | Required |
|---|
| data | CalendarHeatmapDatum[] | Time series data from max a year back | none | yes |
| color | color hex code, valid css color name or color scheme names ('spectral' or 'hsl') | Theme color for the visual elements | #ff4500 | no |
| overview | 'global' | 'year' | 'month' | 'week' | 'day' | Initial overview for the map | year | no |
| handler | (d: CalendarHeatmapDetail) => void; | Handler function is fired on click of a time entry in daily overview | none | no |
| onTooltip | (datum: { value: unknown }) => void; | onTooltip function is fired on "mouseover" over a visual element | none | no |
| onHideTooltip | () => void; | onHideTooltip function is fired on "mouseout" over a visual element | none | no |
Example data
Time series data where each day has a total time tracked (in seconds).
Details, if provided, are shown in a tooltip on mouseover in different overviews.
var data = [{
  "date": "2016-01-01",
  "total": 17164,
  "details": [{
    "name": "Project 1",
    "date": "2016-01-01 12:30:45",
    "value": 9192
  }, {
    "name": "Project 2",
    "date": "2016-01-01 13:37:00",
    "value": 6753
  },
  .....
  {
    "name": "Project N",
    "date": "2016-01-01 17:52:41",
    "value": 1219
  }]
}]
Optimization
In some cases details array could be large and in order to fit the data into the tooltip a short summary is generated with distinct projects and their total tracked time for that date.
In terms of optimization, summary data can be computed server-side and passed in using the ``summary'' attribute.
And in addition to the data structure described above this would result in a summary dictionary with distinct project names and total values of tracked time in seconds, e.g.:
var data = [{
  "date": "2016-01-01",
  "total": 17164,
  "details": [.....],
  "summary": [{
    "name": "Project 1",
    "value": 9192
  }, {
    "name": "Project 2",
    "value": 6753
  },
  .....
  {
    "name": "Project N",
    "value": 1219
  }]
}]
Dependencies


