Drilldown Calendar Heatmap | ReactJS | D3

This d3.js heatmap representing time series data is used to visualize the frequency of an entity over time.
Includes a global overview of multiple years and visualizations of year, month and day overviews.
Inspired by
Demo
Live Link
Global overview

Year overview

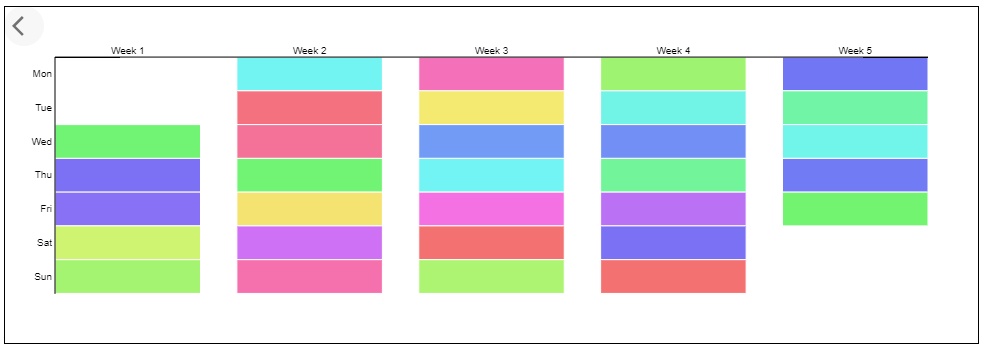
Month overview
Day overview

Install
- Install
@manufac/reactjs-calendar-heatmap with yarn (or npm):
yarn add @manufac/reactjs-calendar-heatmap
- Import
DrilldownCalendar in your component
import { DrilldownCalendar } from '@manufac/reactjs-calendar-heatmap';
- Render
DrilldownCalendar component
<DrilldownCalendar
  data={data}
  color={color}
  overview={overview}
  handler={print}
  onTooltip={show}
  onHideTooltip={hide}
/>
CDN
Available via JSDelivr.
Interfaces
export interface CalendarHeatmapDetail {
  date: string;
  name: string;
  value: number;
}
interface CalendarHeatmapDatum {
  date: string;
  total: number;
  details: CalendarHeatmapDetail[];
  summary?: { name: string; value: number }[];
}
Properties
| Property | Type | Usage | Default | Required |
|---|
| data | CalendarHeatmapDatum[] | Time series data spanning over 1 year or more years | none | yes |
| color | color hex code, valid css color name or color scheme names ('spectral' or 'hsl') | Theme color for the visual elements | #ff4500 | no |
| overview | 'global' | 'year' | 'month' | 'week' | 'day' | Initial overview for the map | year | no |
| handler | (d: CalendarHeatmapDetail) => void; | Handler function is fired on click of a time entry in daily overview | none | no |
| onTooltip | (datum: { value: unknown }) => void; | onTooltip function is fired on "mouseover" over a visual element | none | no |
| onHideTooltip | () => void; | onHideTooltip function is fired on "mouseout" over a visual element | none | no |
Example data
Time series data where each day has a total time tracked (in seconds).
Details, if provided, are shown in a tooltip on mouseover in different overviews.
var data = [{
  "date": "2016-01-01",
  "total": 17164,
  "details": [{
    "name": "Project 1",
    "date": "2016-01-01 12:30:45",
    "value": 9192
  }, {
    "name": "Project 2",
    "date": "2016-01-01 13:37:00",
    "value": 6753
  },
  .....
  {
    "name": "Project N",
    "date": "2016-01-01 17:52:41",
    "value": 1219
  }]
}]
Optimization
In some cases details array could be large and in order to fit the data into the tooltip a short summary is generated with distinct projects and their total tracked time for that date.
In terms of optimization, summary data can be computed server-side and passed in using the ``summary'' attribute.
And in addition to the data structure described above this would result in a summary dictionary with distinct project names and total values of tracked time in seconds, e.g.:
var data = [{
  "date": "2016-01-01",
  "total": 17164,
  "details": [.....],
  "summary": [{
    "name": "Project 1",
    "value": 9192
  }, {
    "name": "Project 2",
    "value": 6753
  },
  .....
  {
    "name": "Project N",
    "value": 1219
  }]
}]


