Drilldown Calendar Heatmap | ReactJS | D3

This d3.js heatmap representing time series data is used to visualize the frequency of an entity over time.
Includes a global overview of multiple years and visualizations of year, month and day overviews.
Inspired by
Demo
Live Link
Global overview

Year overview

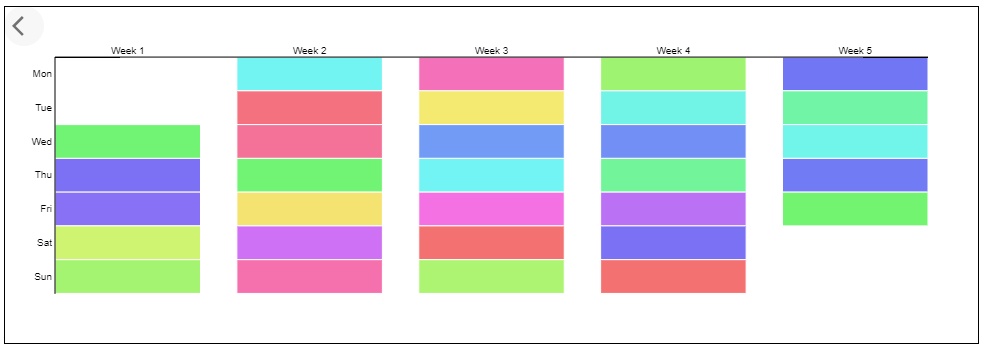
Month overview
Day overview

Install
- Install
@manufac/reactjs-calendar-heatmap with yarn (or npm):
yarn add @manufac/reactjs-calendar-heatmap
- Import
DrilldownCalendar in your component
import { DrilldownCalendar } from '@manufac/reactjs-calendar-heatmap';
- Render
DrilldownCalendar component
<DrilldownCalendar
  data={data}
  color={color}
  overview={overview}
  response={response}
  onTooltip={show}
  onHideTooltip={hide}
/>
CDN
Available via JSDelivr.
Interfaces
export interface CalendarHeatmapDetail {
  date: string;
  value: number;
}
interface CalendarHeatmapDatum {
  date: string;
  total: number;
  details?: CalendarHeatmapDetail[];
}
Properties
| Property | Type | Usage | Default | Required |
|---|
| data | CalendarHeatmapDatum[] | Time series data spanning over 1 year or more years | none | yes |
| color | color hex code, valid css color name or color scheme names ('spectral' or 'hsl') | Theme color for the visual elements | '#ff4500' | no |
| overview | 'global' | 'year' | 'month' | 'week' | 'day' | Initial overview for the map | 'year' | no |
| response | 'hide' | 'rotate' | 'offset' | Responsiveness strategy for handling overlapping axis labels | 'hide' | no |
| onTooltip | (datum: { value: unknown }) => void; | onTooltip function is fired on "mouseover" over a visual element | none | no |
| onHideTooltip | () => void; | onHideTooltip function is fired on "mouseout" over a visual element | none | no |
Example data
The data contains:
- Day-by-day frequency of an arbitrary event spaninng across 1 or more years
- For each data point, the intra-day frequency is also optionally listed in
details
var data = [
  {
    "date": "2016-01-01",
    "total": 17164,
    "details": [{
      "date": "2016-01-01 12:30:45",
      "value": 9192
    },
    ...
    {
      "date": "2016-01-01 17:52:41",
      "value": 1219
    }]
  },
  {
    "date": "2016-01-02",
    "total": 17100,
    "details": [{
      "date": "2016-01-02 11:30:00",
      "value": 9132
    },
    ...
    {
      "date": "2016-01-02 15:52:00",
      "value": 1219
    }]
  }
]


