Kendo UI for Angular Charts Package (Chart, Sparkline, StockChart, and Sankey Components)
- This package is part of Kendo UI for Angular—a commercial library built from the ground-up, specifically for Angular, so that you get high-performance chart components that integrate tightly with your Angular application and with the rest of the Kendo UI for Angular components.
- You must install a license key when adding the package to your project. To receive a license key, either purchase a license or register for a free trial.
- The 30-day free trial gives you access to all the Kendo UI for Angular components and their full functionality. Additionally, for the period of your license, you get access to our legendary technical support provided directly by the Kendo UI for Angular dev team!
Start using Kendo UI for Angular and speed up your development process!
The Kendo UI for Angular Charts provide high quality graphical data visualization options. They include a variety of chart types and styles that have extensive configuration options. This flexibility allows you to quickly and easily create the exact chart you need to fit your specific requirements for functionality and appearance.

What's Included in the Angular Charts Package
The Angular Charts package includes four purpose-built components:
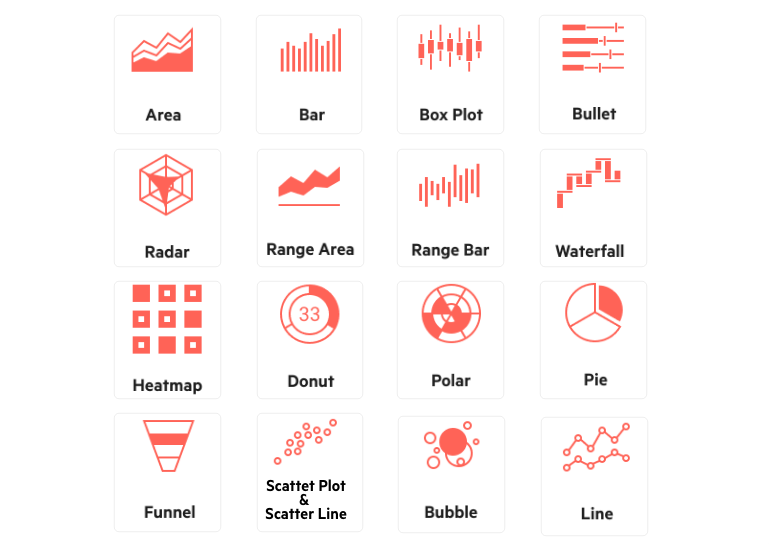
- Angular Chart—These represent a collection of all popular chart types. Each supports robust data binding, multiple axes, pan and zoom, export to image and PDF, extensive and easy customization, and much more. The series types include:
- Angular Stock Chart—A specialized component for exploring financial performance over time. This component inherits most of the features found in the Angular Charts Component.
- Angular Sparkline—A set of tiny charts designed to be embedded into content, ideal for dashboards and spreadsheets. The Angular Sparkline component includes line, bar, column, area, pies, and bullet series types.
- Angular Sankey—A diagram for depicting fluctuating flows through different domains. Sankey diagrams are versatile and can be used in various scenarios such as illustrating web traffic, detailing budget allocations, demonstrating energy transfer, and more.
Key Features
Among the many features which the Kendo UI for Angular Charts deliver are:
- Chart Series Types—The Charts support a wide range of series types such as Categorical, Scatter, Circular, and Freeform.
- Data Binding—The Charts support the binding of their data series to arrays, arrays of arrays, objects, and observables. Beyond the actual series, other areas of the Chart, like the axis and labels, can all be bound to your data as well.
- Rendering Modes—The Charts support two modes for rendering—Canvas (bitmap) and SVG (vector graphics). By default, the Charts are rendered through SVG. Switching between the two is as easy as updating a single configuration option.
- Export Options—The Charts provide built-in support to save your Charts as an Image (PNG), PDF, SVG—without the need for server-side helpers.
- Panning and Zooming—The Charts and Graphs offer intuitive panning and zooming interactions, allowing users to easily explore the data. The developer can enable or disable these features through the Chart options.
- Configuration Options—The Charts and Graphs let you configure their behavior in various ways. This includes ready-to-use configuration components, out-of-the-box inline options, as well as configuration components built with Angular structural directives.
- Context Menu—The Charts work flawlessly with the Kendo UI ContextMenu for Angular so that you can integrate the two components.
- Drilldown—The Kendo UI for Angular Charts support a drilldown functionality for exploring data in a view hierachy.
- Appearance—The colors of the Charts are normally picked up by the current Kendo UI theme, but each aspect of the Chart can be customized by theme variables or configuration options. Kendo UI for Angular delivers a set of popular themes including Bootstrap and Material, all of which can be easily customized with the Progress ThemeBuilder online utility.
- Globalization—The Kendo UI for Angular Charts support globalization and localization to ensure that the each Chart component can fit in any application, no matter what languages and locales need to be supported. Additionally, the Charts support rendering in a right-to-left (RTL) direction, which can be set with a single configuration option.
- Accessibility—The Kendo UI for Angular Chart component is WCAG 2.2 AA and Section 508 compliant, incorporating WAI-ARIA best practices for modern web accessibility. The Angular Chart is also tested against the popular screen readers, including JAWS and NVDA.
- Keyboard Navigation—The Angular Charts support a number of keyboard shortcuts which allow users to accomplish various commands.
- More Complex Charts—You can combine many of the chart features into the same component to achieve complex graphs with many series and varied configuration to suit your business needs.
Support Options
For any issues you might encounter while working with the Kendo UI for Angular Charts, you have the following support channels available:
Resources
Copyright © 2025 Progress Software Corporation and/or one of its subsidiaries or affiliates. All rights reserved.
Progress, Telerik, and certain product names used herein are trademarks or registered trademarks of Progress Software Corporation and/or one of its subsidiaries or affiliates in the U.S. and/or other countries.


