Security News
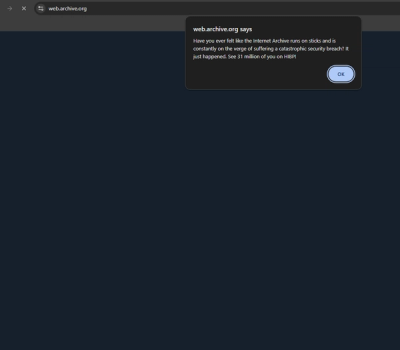
Internet Archive Hacked, 31 Million Record Compromised
The Internet Archive's "Wayback Machine" has been hacked and defaced, with 31 millions records compromised.
By Sarah Gooding - Oct 10, 2024
@types/chart.js
Advanced tools
@types/chart.js provides TypeScript type definitions for the Chart.js library, which is a popular JavaScript library for creating various types of charts and graphs. These type definitions help developers use Chart.js in TypeScript projects by providing type safety and autocompletion features.
Creating a Line Chart
This code sample demonstrates how to create a basic line chart using Chart.js with TypeScript. The type definitions provided by @types/chart.js ensure that the configuration object adheres to the expected structure.
const lineChartConfig: Chart.ChartConfiguration = {
type: 'line',
data: {
labels: ['January', 'February', 'March', 'April', 'May', 'June', 'July'],
datasets: [{
label: 'My First dataset',
backgroundColor: 'rgba(75,192,192,0.4)',
borderColor: 'rgba(75,192,192,1)',
data: [65, 59, 80, 81, 56, 55, 40]
}]
},
options: {
responsive: true
}
};
const ctx = document.getElementById('myChart') as HTMLCanvasElement;
new Chart(ctx, lineChartConfig);Creating a Bar Chart
This code sample demonstrates how to create a bar chart using Chart.js with TypeScript. The type definitions ensure that the configuration object is correctly structured and provide autocompletion for the properties.
const barChartConfig: Chart.ChartConfiguration = {
  type: 'bar',
  data: {
    labels: ['Red', 'Blue', 'Yellow', 'Green', 'Purple', 'Orange'],
    datasets: [{
      label: '# of Votes',
      data: [12, 19, 3, 5, 2, 3],
      backgroundColor: [
        'rgba(255, 99, 132, 0.2)',
        'rgba(54, 162, 235, 0.2)',
        'rgba(255, 206, 86, 0.2)',
        'rgba(75, 192, 192, 0.2)',
        'rgba(153, 102, 255, 0.2)',
        'rgba(255, 159, 64, 0.2)'
      ],
      borderColor: [
        'rgba(255, 99, 132, 1)',
        'rgba(54, 162, 235, 1)',
        'rgba(255, 206, 86, 1)',
        'rgba(75, 192, 192, 1)',
        'rgba(153, 102, 255, 1)',
        'rgba(255, 159, 64, 1)'
      ],
      borderWidth: 1
    }]
  },
  options: {
    scales: {
      yAxes: [{
        ticks: {
          beginAtZero: true
        }
      }]
    }
  }
};
const ctx = document.getElementById('myChart') as HTMLCanvasElement;
new Chart(ctx, barChartConfig);
Creating a Pie Chart
This code sample demonstrates how to create a pie chart using Chart.js with TypeScript. The type definitions help ensure that the configuration object is correctly structured and provide autocompletion for the properties.
const pieChartConfig: Chart.ChartConfiguration = {
  type: 'pie',
  data: {
    labels: ['Red', 'Blue', 'Yellow'],
    datasets: [{
      data: [300, 50, 100],
      backgroundColor: [
        '#FF6384',
        '#36A2EB',
        '#FFCE56'
      ],
      hoverBackgroundColor: [
        '#FF6384',
        '#36A2EB',
        '#FFCE56'
      ]
    }]
  },
  options: {
    responsive: true
  }
};
const ctx = document.getElementById('myChart') as HTMLCanvasElement;
new Chart(ctx, pieChartConfig);@types/d3 provides TypeScript type definitions for D3.js, a powerful library for creating complex and interactive data visualizations. Compared to Chart.js, D3.js offers more flexibility and control over the visualizations but has a steeper learning curve.
@types/plotly.js provides TypeScript type definitions for Plotly.js, a library for creating interactive and publication-quality charts. Plotly.js supports a wide range of chart types and is known for its interactivity and ease of use, similar to Chart.js.
@types/echarts provides TypeScript type definitions for ECharts, a powerful charting and visualization library. ECharts offers a wide variety of chart types and is highly customizable, making it a strong alternative to Chart.js for more complex visualizations.
npm install --save @types/chart.js
This package contains type definitions for Chart.js (https://github.com/nnnick/Chart.js).
Files were exported from https://github.com/DefinitelyTyped/DefinitelyTyped/tree/master/types/chart.js.
ChartThese definitions were written by Alberto Nuti, Fabien Lavocat, KentarouTakeda, Larry Bahr, Daniel Luz, Joseph Page, Dan Manastireanu, Guillaume Rodriguez, Simon Archer, Ken Elkabany, Francesco Benedetto, Alexandros Dorodoulis, Manuel Heidrich, Conrad Holtzhausen, Adrián Caballero, wertzui, Martin Trobäck, Elian Cordoba, Takuya Uehara, Ricardo Mello, Ray Nicholus, Oscar Cabrera, Carlos Anoceto, Nobuhiko Futagami, and Marco Ru.
FAQs
TypeScript definitions for chart.js
The npm package @types/chart.js receives a total of 322,274 weekly downloads. As such, @types/chart.js popularity was classified as popular.
We found that @types/chart.js demonstrated a healthy version release cadence and project activity because the last version was released less than a year ago. It has 1 open source maintainer collaborating on the project.
Did you know?

Socket for GitHub automatically highlights issues in each pull request and monitors the health of all your open source dependencies. Discover the contents of your packages and block harmful activity before you install or update your dependencies.
Security News
The Internet Archive's "Wayback Machine" has been hacked and defaced, with 31 millions records compromised.
Security News
TC39 is meeting in Tokyo this week and they have approved nearly a dozen proposals to advance to the next stages.

Security News
Our threat research team breaks down two malicious npm packages designed to exploit developer trust, steal your data, and destroy data on your machine.