Security News
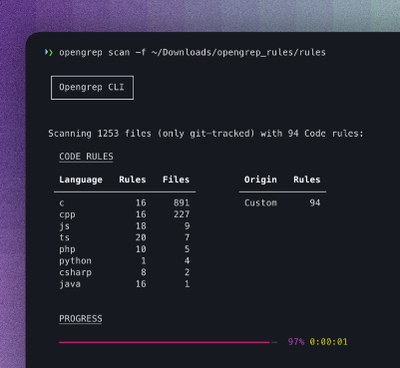
Opengrep Emerges as Open Source Alternative Amid Semgrep Licensing Controversy
Opengrep forks Semgrep to preserve open source SAST in response to controversial licensing changes.
Chart.Annotation.js
Advanced tools
An annotation plugin for Chart.js >= 2.1.3
Currently draws lines and boxes on the chart area.
To configure the annotations plugin, you can simply add new config options to your chart config.
{
annotation: {
annotations: [{
type: 'line',
mode: 'horizontal',
scaleID: 'y-axis-1',
value: '25',
borderColor: 'red',
borderWidth: 2
}]
}
}
Vertical or horizontal lines are supported.
{
	type: 'line',
	// set to 'vertical' to draw a vertical line
	mode: 'horizontal',

	// ID of the scale to bind onto
	scaleID: 'y-axis-1',

	// Data value to draw the line at
	value: 25,

	// Line color
	borderColor: 'red',

	// Line width
	borderWidth: 2
}
Box annotations are supported. If one of the axes is not specified, the box will take the entire chart dimension.
The 4 coordinates, xMin, xMax, yMin, yMax are optional. If not specified, the box is expanded out to the edges
{
	type: 'box',

	// ID of the X scale to bind onto
	xScaleID: 'x-axis-1',

	// ID of the Y scale to bind onto
	scaleID: 'y-axis-1',

	// Left edge of the box. in units along the x axis
	xMin: 25,

	// Right edge of the box
	xMax: 40,

	// Top edge of the box in units along the y axis
	yMax: 20,

	// Bottom edge of the box
	yMin:  15,

	// Stroke color
	borderColor: 'red',

	// Stroke width
	borderWidth: 2,

	// Fill color
	backgroundColor: 'green'
}
The following features still need to be done:
To download a zip, go to the Chart.Annotation.js on Github
To install via npm / bower:
npm install Chart.Annotation.js --save
You can find documentation for Chart.js at www.chartjs.org/docs.
Before submitting an issue or a pull request to the project, please take a moment to look over the contributing guidelines first.
Chart.Annotation.js is available under the MIT license.
FAQs
Annotations for Chart.js
The npm package Chart.Annotation.js receives a total of 3 weekly downloads. As such, Chart.Annotation.js popularity was classified as not popular.
We found that Chart.Annotation.js demonstrated a not healthy version release cadence and project activity because the last version was released a year ago. It has 1 open source maintainer collaborating on the project.
Did you know?

Socket for GitHub automatically highlights issues in each pull request and monitors the health of all your open source dependencies. Discover the contents of your packages and block harmful activity before you install or update your dependencies.

Security News
Opengrep forks Semgrep to preserve open source SAST in response to controversial licensing changes.

Security News
Critics call the Node.js EOL CVE a misuse of the system, sparking debate over CVE standards and the growing noise in vulnerability databases.

Security News
cURL and Go security teams are publicly rejecting CVSS as flawed for assessing vulnerabilities and are calling for more accurate, context-aware approaches.