Security News
Opengrep Emerges as Open Source Alternative Amid Semgrep Licensing Controversy
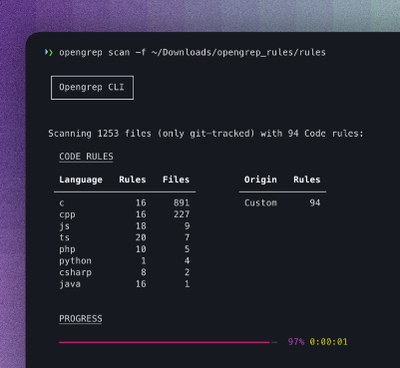
Opengrep forks Semgrep to preserve open source SAST in response to controversial licensing changes.
appmetrics
Advanced tools
Node Application Metrics monitoring and profiling agent
Node Application Metrics instruments the Node.js runtime for performance monitoring, providing the monitoring data via an API. Additionally the data can be visualized in an Eclipse IDE using the IBM Monitoring and Diagnostics Tools - Health Center client.
See https://www.ibm.com/developerworks/java/jdk/tools/healthcenter/ for more details.
Node Application Metrics provides the following built-in data collection sources:
| Source | Description |
|---|---|
| Environment | Machine and runtime environment information |
| CPU | Process and system CPU |
| Memory | Process and system memory usage |
| GC | Node/V8 garbage collection statistics |
| Function profiling | Node/V8 function profiling (disabled by default) |
| HTTP | HTTP request calls made of the application |
| MySQL | MySQL queries made by the application |
| MongoDB | MongoDB queries made by the application |
| Request tracking | A tree of application requests, events and optionally trace (disabled by default) |
| Function trace | Tracing of application function calls that occur during a request (disabled by default) |
The Node Application Metrics agent supports the following runtime environments:
Node Application Metrics can be installed using npm either locally or globally.
When installed locally you can access monitoring data via both the API and the Health Center client by modifying your application to use appmetrics (see Modifying your application to use the local installation).
To perform a local install:
$ npm install appmetrics
A local install will put the module inside "./node_modules of the current package root" (see the npm documentation for more information); usually this is the current directory and in that case the module installation directory will be ./node_modules/appmetrics.
When installed globally you can access monitoring data via the Health Center client (but not the API) by using the node-hc command-line utility (see The node-hc command).
To perform a global install:
$ npm install -g appmetrics
A global install will put the module inside a directory tied to your Node.js SDK.
<UserDirectory>\AppData\Roaming\npm\node_modules<NodeInstallDirectory>\node_modules<node_install_directory>/lib/node_modulesIt also adds the node-hc command to another directory tied to your Node.js SDK, one that was added to your executable search path by the Node.js SDK installer.
<UserDirectory>\AppData\Roaming\npm<NodeInstallDirectory><node_install_directory>/binNode Application Metrics comes with a configuration file inside the module installation directory (.../node_modules/appmetrics/appmetrics.properties). This is used to configure connection options, logging and data source options.
Node Application Metrics will attempt to load appmetrics.properties from one of the following locations (in order):
The default configuration has minimal logging enabled, will attempt to send data to a local MQTT server on the default port and has method profiling disabled.
Many of the options provide configuration of the Health Center core agent library and are documented in the Health Center documentation: Health Center configuration properties.
The following options are specific to appmetrics:
com.ibm.diagnostics.healthcenter.data.profiling=[off|on]
Specifies whether method profiling data will be captured. The default value is off. This specifies the value at start-up; it can be enabled and disabled dynamically as the application runs, either by a monitoring client or the API.node-hc commandIf you globally installed this module with npm, you can use the node-hc command to run your application instead of the node command. This will run your application as it would normally under node (including any node options) but additionally load and start appmetrics.
$ node-hc app.js
The purpose of this mode of operation is to provide monitoring of the application without requiring any changes to the application code. The data is sent to the Health Center Eclipse IDE client.
If you locally install this module with npm then you will additionally have access to the monitoring data via the appmetrics API (see API Documentation).
To load appmetrics and get the monitoring API object, add the following to the start-up code for your application:
var appmetrics = require('appmetrics');
var monitoring = appmetrics.monitor();
The call to appmetrics.monitor() starts the data collection agent, making the data available via the API and to the Heath Center client via MQTT.
You should start your application using the node command as usual (not node-hc).
You can then use the monitoring object to register callbacks and request information about the application:
monitoring.on('initialized', function (env) {
    env = monitoring.getEnvironment();
    for (var entry in env) {
        console.log(entry + ':' + env[entry]);
    };
});

monitoring.on('cpu', function (cpu) {
    console.log('[' + new Date(cpu.time) + '] CPU: ' + cpu.process);
});
Connecting to the Health Center client requires the additional installation of a MQTT broker. The Node Application Metrics agent sends data to the MQTT broker specified in the appmetrics.properties file. Installation and configuration documentation for the Health Center client is available from the Health Center documentation in IBM Knowledge Center.
Note that both the API and the Health Center client can be used at the same time and will receive the same data. Use of the API requires a local install and application modification (see Modifying your application to use the local installation).
Further information regarding the use of the Health Center client with Node Application Metrics can be found on the appmetrics wiki: Using Node Application Metrics with the Health Center client.
Starts the appmetrics monitoring agent. If the agent is already running this function does nothing.
Stops the appmetrics monitoring agent. If the agent is not running this function does nothing.
type, config)Enable data generation of the specified data type.
type (String) the type of event to start generating data for. Values of 'profiling', 'http', 'mongo', 'mysql', 'requests' and 'trace' are currently supported. As trace is added to request data, both requests and trace must be enabled in order to receive trace data.config (Object) (optional) configuration map to be added for the data type being enabled. (see setConfig) for more information.The following data types are disabled by default: profiling, requests, trace
type)Disable data generation of the specified data type.
type (String) the type of event to stop generating data for. Values of profiling, http, mongo, mysql, requests and trace are currently supported.type, config)Set the configuration to be applied to a specific data type. The configuration available is specific to the data type.
type (String) the type of event to apply the configuration to.config (Object) key value pairs of configurations to be applied to the specified event. The available configuration options are as follows:| Source | Configuration | Effect |
|---|---|---|
http | filters | (Array) of URL filter Objects consisting of: |
        |                          | `pattern` (String) a regular expression pattern to match HTTP method and URL against, eg. 'GET /favicon.ico$'
        |                          | `to` (String) a conversion for the URL to allow grouping. A value of `''` causes the URL to be ignored.
requests | excludeModules | (Array) of String names of modules to exclude from request tracking.
trace | includeModules | (Array) of String names for modules to include in function tracing. By default only non-module functions are traced when trace is enabled.
type, data)Allows custom monitoring events to be added into the Node Application Metrics agent.
type (String) the name you wish to use for the data. A subsequent event of that type will be raised, allowing callbacks to be registered for it.data (Object) the data to be made available with the event. The object must not contain circular references, and by convention should contain a time value representing the milliseconds when the event occurred.Creates a Node Application Metrics agent client instance. This can subsequently be used to get environment data and subscribe to data events. This function will start the appmetrics monitoring agent if it is not already running.
Requests an object containing all of the available environment information for the running application.
Emitted when a CPU monitoring sample is taken.
data (Object) the data from the CPU sample:
time (Number) the milliseconds when the sample was taken. This can be converted to a Date using new Date(data.time).process (Number) the percentage of CPU used by the Node.js application itself. This is a value between 0.0 and 1.0.system (Number) the percentage of CPU used by the system as a whole. This is a value between 0.0 and 1.0.Emitted when a memory monitoring sample is taken.
data (Object) the data from the memory sample:
time (Number) the milliseconds when the sample was taken. This can be converted to a Date using new Date(data.time).physical_total (Number) the total amount of RAM available on the system in bytes.physical_used (Number) the total amount of RAM in use on the system in bytes.physical_free (Number) the total amount of free RAM available on the system in bytes.virtual (Number) the memory address space used by the Node.js application in bytes.private (Number) the amount of memory used by the Node.js application that cannot be shared with other processes, in bytes.physical (Number) the amount of RAM used by the Node.js application in bytes.Emitted when a garbage collection (GC) cycle occurs in the underlying V8 runtime.
data (Object) the data from the GC sample:
time (Number) the milliseconds when the sample was taken. This can be converted to a Date using new Date(data.time).type (String) the type of GC cycle, either 'M' or 'S'.size (Number) the size of the JavaScript heap in bytes.used (Number) the amount of memory used on the JavaScript heap in bytes.duration (Number) the duration of the GC cycle in milliseconds.Emitted when a profiling sample is available from the underlying V8 runtime.
data (Object) the data from the profiling sample:
time (Number) the milliseconds when the sample was taken. This can be converted to a Date using new Date(data.time).functions (Array) an array of functions that ran during the sample. Each array entry consists of:
self (Number) the ID for this function.parent (Number) the ID for this function's caller.name (String) the name of this function.file (String) the file in which this function is defined.line (Number) the line number in the file.count (Number) the number of samples for this function.Emitted when a HTTP request is made of the application.
data (Object) the data from the HTTP request:
time (Number) the milliseconds when the request was made. This can be converted to a Date using new Date(data.time).method (String) the HTTP method used for the request.url (String) the URL on which the request was made.duration (Number) the time taken for the HTTP request to be responded to in ms.Emitted when a MySQL query is made using the mysql module.
data (Object) the data from the MySQL query:
time (Number) the milliseconds when the MySQL query was made. This can be converted to a Date using new Date(data.time).query (String) the query made of the MySQL database.duration (Number) the time taken for the MySQL query to be responded to in ms.Emitted when a MongoDB query is made using the mongodb module.
data (Object) the data from the MongoDB request:
time (Number) the milliseconds when the MongoDB query was made. This can be converted to a Date using new Date(data.time)query (String) the query made of the MongoDB database.duration (Number) the time taken for the MongoDB query to be responded to in ms.Emitted when a request is made of the application that involves one or more monitored application level events. Request events are disabled by default.
data (Object) the data from the request:
time (Number) the milliseconds when the request occurred. This can be converted to a Date using new Date(data.time).type (String) The type of the request event. This can currently be set to 'HTTP' or 'DB'.name (String) The name of the request event. This is the request task, eg. the url, or the method being used.request (Object) the detailed data for the root request event:
type (String) The type of the request event. This can currently be set to 'HTTP' or 'DB'.name (String) The name of the request event. This is the request task, eg. the url, or the method being used.context (Object) A map of any additional context information for the request event.stack (String) A stack trace for the event call.children (Array) An array of child request events that occurred as part of the overall request event. Child request events may include function trace entries, which will have a type of null.duration (Number) the time taken for the request to complete in ms.duration (Number) the time taken for the overall request to complete in ms.Find below some possible problem scenarios and corresponding diagnostic steps. Updates to troubleshooting information will be made available on the appmetrics wiki: Troubleshooting. If these resources do not help you resolve the issue, you can open an issue on the Node Application Metrics appmetrics issue tracker.
By default, a message similar to the following will be written to console output when Node Application Metrics starts:
[Fri Aug 21 09:36:58 2015] com.ibm.diagnostics.healthcenter.loader INFO: Node Application Metrics 1.0.1-201508210934 (Agent Core 3.0.5.201508210934)
node-hcThis error indicates you are using node-hc to run an application that uses the Node Application Metrics monitoring API (see Modifying your application to use the local installation). Resolve this by using node to run the application instead. Alternatively, you could remove (or disable temporarily) the use of the Node Application Metrics monitoring API in your application.
This error was added to prevent the scenario where 2 instances of the agent can be accidentally created and started in parallel -- the globally installed one created by node-hc and the locally installed one created by the require('appmetrics'); call in an application modified to use the Node Application Metrics monitoring API.
This error indicates there was a problem while loading the native part of the module or one of its dependent libraries. On Windows, appmetrics.node depends on a particular version of the C runtime library and if it cannot be found this error is the likely result.
Check:
appmetrics.node file exist in the indicated location? If not, try reinstalling the module.1.0.0 on Windows: are msvcr100.dll and msvcp100.dll installed on your Windows system, and do they match the bitness (32-bit or 64-bit) of your Node.js runtime environment? If not, you may be able to install them with the Visual C++ Redistributable Packages for Visual Studio 2010 package from the Microsoft website.1.0.1 on Windows: does msvcr120.dll and msvcp120.dll exist in the module installation directory (see Installation) and does it match the bitness of your Node.js runtime environment? If not, try reinstalling the module.Note: On Windows, the global module installation directory might be shared between multiple Node.js runtime environments. This can cause problems with globally installed modules with native components, particularly if some of the Node.js runtime environments are 32-bit and others are 64-bit because the native components will only work with those with matching bitness.
Method profiling data is not collected by default, check Configuring Node Application Metrics for information on how to enable it.
If collection is enabled, an absence of method profiling data from a Node.js application could be caused by the type of tasks that are being run by your application -- it may be running long, synchronous tasks that prevent collection events from being scheduled on the event loop.
If a task uses the Node.js thread exclusively then shuts down the Node.js runtime environment, the Health Center agent may not get the opportunity to obtain any profiling data. An example of such an application is the Octane JavaScript benchmark suite, which loads the CPU continuously rather than dividing the load across multiple units of work.
The source code for Node Application Metrics is available in the appmetrics project. Information on working with the source code -- installing from source, developing, contributing -- is available on the appmetrics wiki.
This project is released under an Apache 2.0 open source license, however it has a dependency on a common agent from IBM Monitoring and Diagnostic Tools - Health Center, which has a proprietary IBM license.
The npm package for this project uses a semver-parsable X.0.Z version number for releases, where X is incremented for breaking changes to the public API described in this document and Z is incremented for bug fixes and for non-breaking changes to the public API that provide new function.
Non-release versions of this project (for example on github.com/RuntimeTools/appmetrics) will use semver-parsable X.0.Z-dev.B version numbers, where X.0.Z is the last release with Z incremented and B is an integer. For further information on the development process go to the appmetrics wiki: Developing.
1.0.2
1.0.2 - HTTP, MySQL, MongoDB, request tracking and function tracing support
1.0.1 - Mac OS X support, io.js v2 support
1.0.0 - First release
FAQs
Node Application Metrics
The npm package appmetrics receives a total of 186 weekly downloads. As such, appmetrics popularity was classified as not popular.
We found that appmetrics demonstrated a not healthy version release cadence and project activity because the last version was released a year ago. It has 7 open source maintainers collaborating on the project.
Did you know?

Socket for GitHub automatically highlights issues in each pull request and monitors the health of all your open source dependencies. Discover the contents of your packages and block harmful activity before you install or update your dependencies.

Security News
Opengrep forks Semgrep to preserve open source SAST in response to controversial licensing changes.

Security News
Critics call the Node.js EOL CVE a misuse of the system, sparking debate over CVE standards and the growing noise in vulnerability databases.

Security News
cURL and Go security teams are publicly rejecting CVSS as flawed for assessing vulnerabilities and are calling for more accurate, context-aware approaches.