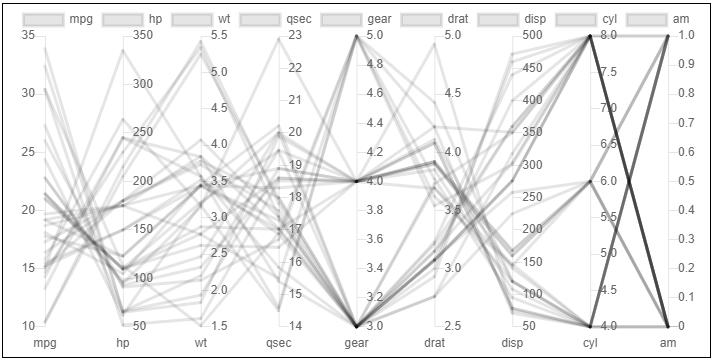
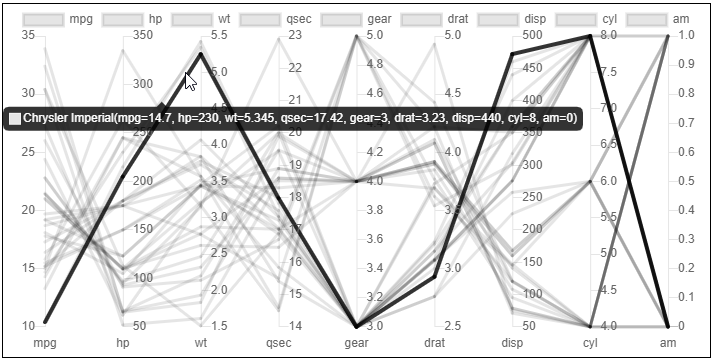
Chart.js Parallel Coordinate Plots


Chart.js module for charting parallel coordinate plots (PCPs). Adding new chart type: pcp.


Related Plugins
Check out also my other chart.js plugins:
Install
npm install --save chart.js chartjs-chart-pcp
Usage
see Examples
PCP
Data Structure
the data items are the regular data items along with their labels. For each attribute there is a dataset. e.g., in the following example there are three items (A, B, C) with three axes / features (f1, f2, f3).
const objs = [
  { label: 'A', f1: 5, f2: 3, f4: 3 },
  { label: 'B', f1: 2, f2: 1, f4: 8 },
  { label: 'C', f1: 10, f2: 6, f4: 2 },
];
const attrs = ['f1', 'f2', 'f3'];
const config = {
  type: 'pcp',
  data: {
    labels: objs.map((obj) => obj.label),
    datasets: attrs.map((attr) => ({
      label: attr,
      data: objs.map((obj) => obj[attr]),
    })),
  },
  options: {},
};
Styling of elements
Two new elements were added: lineSegment as a subclass of line for a line segment between two axes and linearAxis for representing the vertical axis as a wrapper around a linear scale.
see https://github.com/sgratzl/chartjs-chart-pcp/blob/develop/src/elements/lineSegment.ts#L3-L9
see https://github.com/sgratzl/chartjs-chart-pcp/blob/develop/src/elements/axis.ts#L13-L21
Scaling
The Parallel Coordinates controller pcp uses a linear scale. There is also the logarithmicPcp that uses a logarithmic scale.
Using chart.js hybrid charts, one can specify the type per dataset. e.g.,
const config = {
  type: 'pcp',
  data: {
    labels: ['1', '2', '3'],
    datasets: [
      {
        label: 'A',
        data: [1, 2, 3]
      },
      {
        type: 'logarithmicPcp',
        label: 'B',
        data: [1, 2, 10000]
      }
    })),
  },
  options: {},
};
ESM and Tree Shaking
The ESM build of the library supports tree shaking thus having no side effects. As a consequence the chart.js library won't be automatically manipulated nor new controllers automatically registered. One has to manually import and register them.
Variant A:
import Chart from 'chart.js';
import { ParallelCoordinatesController, LinearAxis, LineSegment, PCPScale } from 'chartjs-chart-pcp';

Chart.register(ParallelCoordinatesController, PCPScale, LineSegment);
Chart.registry.addElements(LinearAxis);
...

new Chart(ctx, {
  type: ParallelCoordinatesController.id,
  data: [...],
});
Variant B:
import { ParallelCoordinatesChart } from 'chartjs-chart-pcp';

new ParallelCoordinatesChart(ctx, {
  data: [...],
});
Development Environment
npm i -g yarn
yarn install
yarn sdks vscode
Common commands
yarn compile
yarn test
yarn lint
yarn fix
yarn build
yarn docs


