Security News
PyPI’s New Archival Feature Closes a Major Security Gap
PyPI now allows maintainers to archive projects, improving security and helping users make informed decisions about their dependencies.
chartjs-plugin-doughnutlabel-rebourne
Advanced tools
Chart.js plugin for doughnut chart to display lines of text in the center
Chart.js plugin module that allows to display multiple lines of text centered in the middle area of the doughnut charts. This plugin is forked from https://github.com/ciprianciurea/chartjs-plugin-doughnutlabel to provide support for Chart.js v3 as well as some other improvements and bug fixes. This is a BREAKING change meaning this plugin will NOT work with Chart.js v3.
Have a look at the Demo page.
Install through yarn:
yarn install chartjs-plugin-doughnutlabel-rebourne
Don't forget to install v3 of Chart.js:
yarn install chart.js@next
After that, you need to activate the plugin, either globally :
Chart.plugins.register(DoughnutLabel);
or for each chart separately:
new Chart(ctx, {
  plugins: [DoughnutLabel],
});
Below is a table with available options:
| Option | Description | Label Scope | Plugin Scope | Global Scope |
|---|---|---|---|---|
paddingPercentage | add padding when scaling text larger than inner circle (defaults to 10) | ✓ | ✓ | |
labels | array of labels (objects) | ✓ | ||
color | css property | ✓ | ✓ | ✓ |
font.family | css property | ✓ | ✓ | ✓ |
font.lineHeight | css property | ✓ | ✓ | ✓ |
font.size | css property | ✓ | ✓ | ✓ |
font.style | css property | ✓ | ✓ | ✓ |
font.weight | css property | ✓ | ✓ | ✓ |
font.string | all previous font properties in one string separated by space | ✓ | ✓ | ✓ |
text | value of label (can be string or function) | ✓ | ||
display | show label or not | ✓ | ✓ | ✓ |
api* | plugin core api (defaults to beforeDatasetDraw) | ✓ | ✓ |
*Option api is a really-low level and intended for developers and those who are familar with internal workings of Chart.js (or have experience making plugins).
Note that more specific scope will override more global. For example, if you declare color in plugin scope and in label scope, value from label scope will win.
Options with global scope have a special meaning - they will always have a default value, i.e. if other scopes have no value, the final option will taken from Chart.defaults scope.
Chart.defaults.plugins.doughnutlabel = {}; // global scope

options: {
  plugins: {
    doughnutlabel: { // plugin scope
      paddingPercentage: 5,
      labels: [
        { // label scope
          text: 'Text' or functionName,
          font: {
            size: '24',
            family: 'Arial, Helvetica, sans-serif',
            style: 'italic',
            weight: 'bold',
          },
          color: '#bc2c1a',
        },
      ],
    },
  },
},
Using CDN is probably the best way - jsDelivr. Select the .min file with SRI parameters for extra safety. If you need to debug any issues, select the full version instead.
Alternatively, the plugin can be manually downloaded from the Releases page on GitHub!
<script src="chartjs-plugin-doughnutlabel-rebourne.js"></script>
or use the minified version
<script src="chartjs-plugin-doughnutlabel-rebourne.min.js"></script>
You first need to install node dependencies (requires Node.js):
yarn install
The following commands are available via package.json:
| Command | Purpose |
|---|---|
yarn lint | perform code linting |
yarn build | build dist files |
yarn build --watch | build and watch for changes (inc. browser-sync) |
yarn package | create an archive with dist files and samples |
chartjs-plugin-doughnutlabel is available under the MIT license.
FAQs
Chart.js plugin for doughnut chart to display lines of text in the center
The npm package chartjs-plugin-doughnutlabel-rebourne receives a total of 2,482 weekly downloads. As such, chartjs-plugin-doughnutlabel-rebourne popularity was classified as popular.
We found that chartjs-plugin-doughnutlabel-rebourne demonstrated a not healthy version release cadence and project activity because the last version was released a year ago. It has 1 open source maintainer collaborating on the project.
Did you know?

Socket for GitHub automatically highlights issues in each pull request and monitors the health of all your open source dependencies. Discover the contents of your packages and block harmful activity before you install or update your dependencies.

Security News
PyPI now allows maintainers to archive projects, improving security and helping users make informed decisions about their dependencies.

Research
Security News
Malicious npm package postcss-optimizer delivers BeaverTail malware, targeting developer systems; similarities to past campaigns suggest a North Korean connection.

Security News
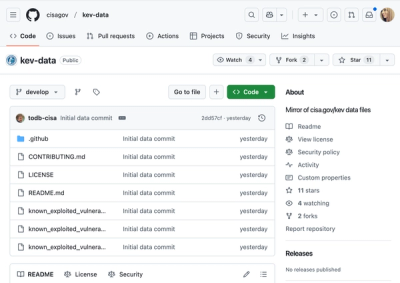
CISA's KEV data is now on GitHub, offering easier access, API integration, commit history tracking, and automated updates for security teams and researchers.