Security News
UK Officials Consider Banning Ransomware Payments from Public Entities
The UK is proposing a bold ban on ransomware payments by public entities to disrupt cybercrime, protect critical services, and lead global cybersecurity efforts.
chartjs-plugin-dragdata
Advanced tools
Now compatible with Chart.js v3 🎉
Looking for a version compatible to Chart.js < 2.9.x? Then visit the v2 branch!
A plugin for Chart.js >= 2.4.0
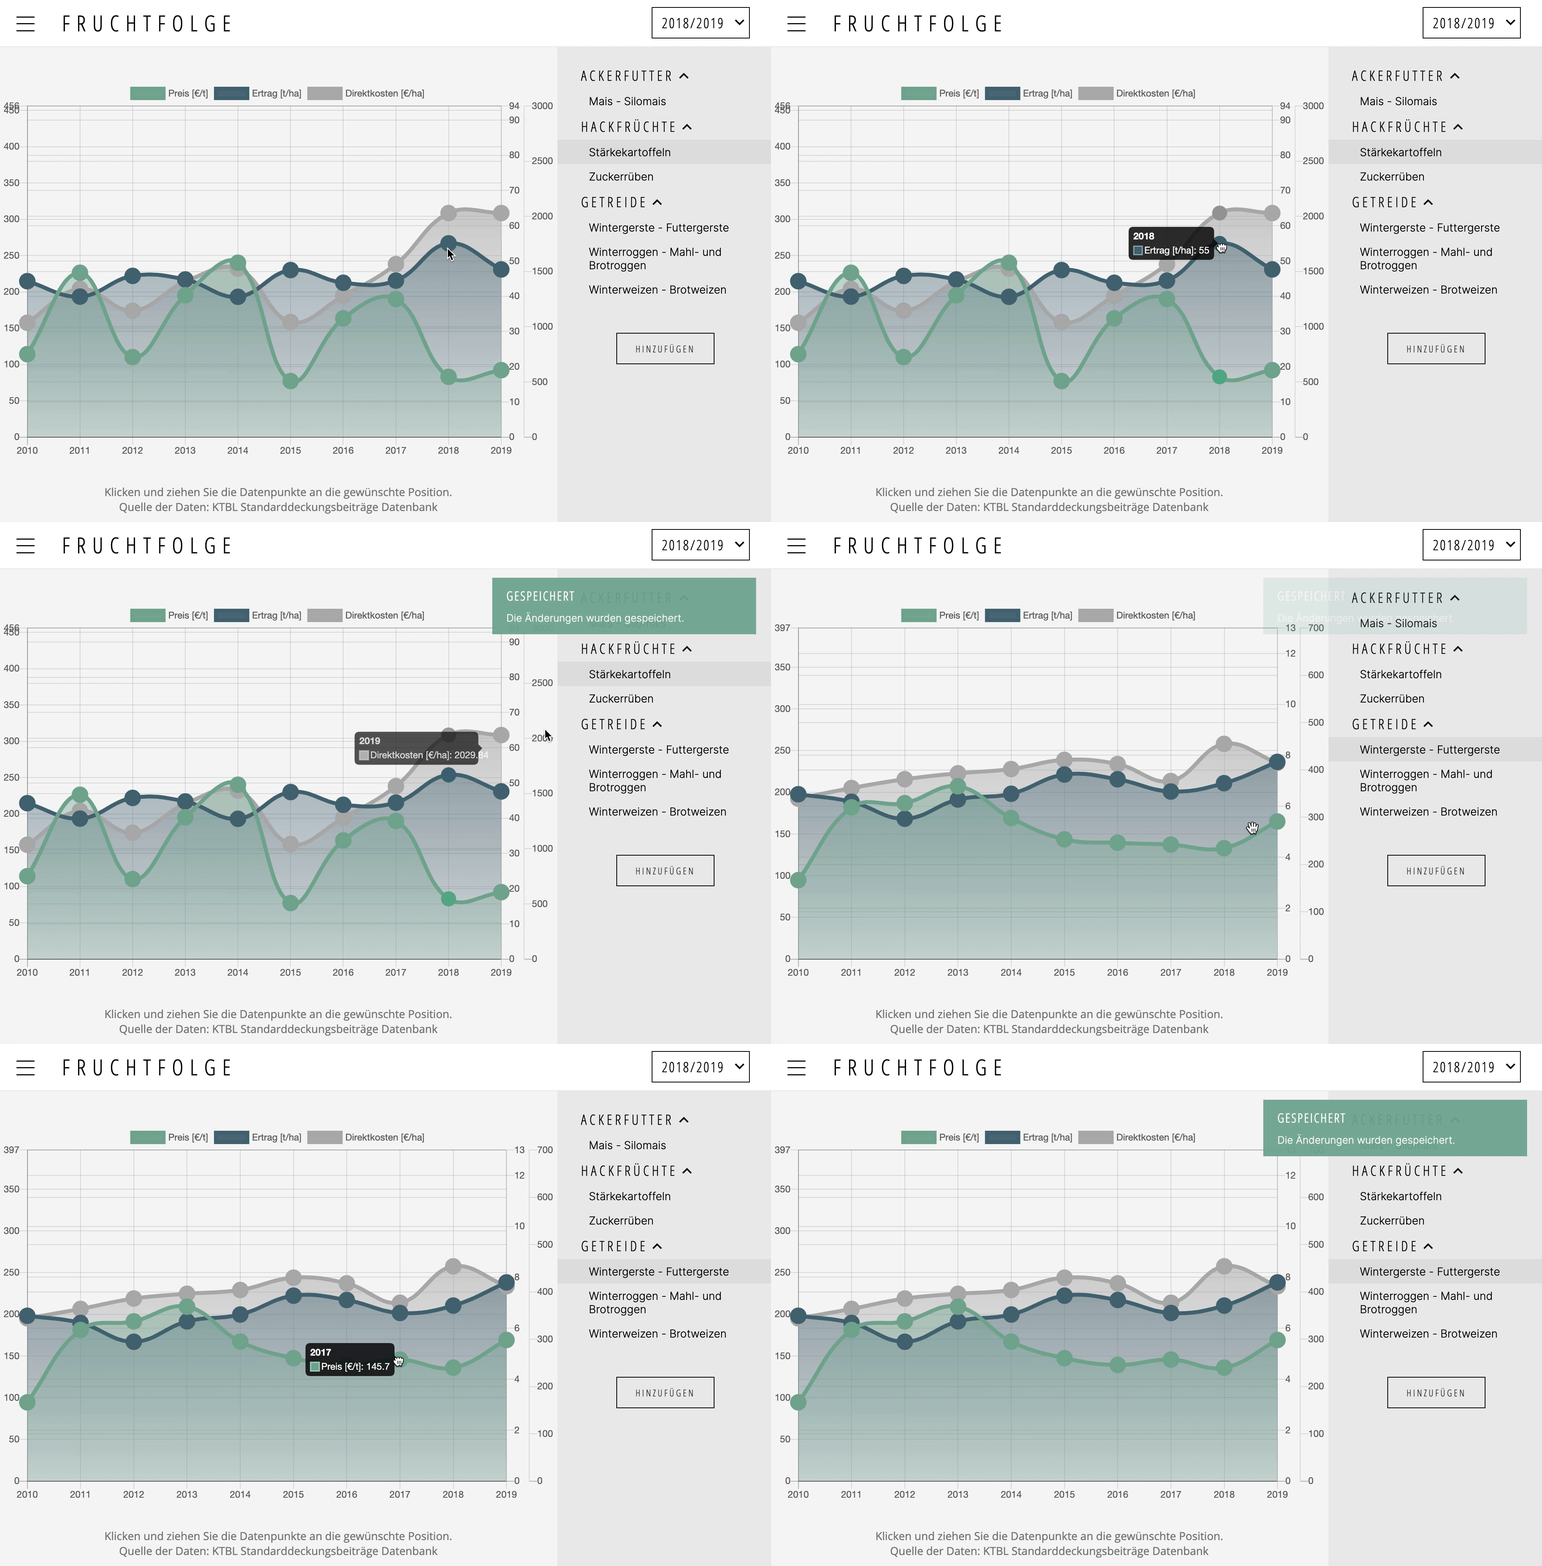
Makes data points draggable. Supports touch events.

| Chart Type | Demo | Source |
|---|---|---|
| Bar - Simple Bar | demo | source |
| Bubble - Simple Bubble | demo | source |
| Horizontal Bar - Simple Horizontal Bar | demo | source |
| Line - Single Y-Axis | demo | source |
| Line - Dual Y-Axis | demo | source |
| Line - Drag multiple points | demo | source |
| Line - Small | demo | source |
| Line - React Fiddle | demo | source |
| Line - Drag x-, and y-axis (scatter chart) | demo | source |
| Line - Drag dates (x and y axis) | demo | source |
| Line - Zoom, Pan, and drag data points (combination with chartjs-plugin-zoom | demo | source |
| Mixed - Bar, Bubble, and line Chart | demo | source |
| Radar - Simple Radar | demo | source |
| Polar - Simple Polar | demo | source |
| Stacked Bar - Simple Stacked Bar | demo | source |
| Stacked Horizontal Bar - Simple Stacked Horizontal Bar | demo | source |
Click here to learn how to use this plugin in an Observable notebook.
npm install chartjs-plugin-dragdata
In browsers, you may use the following script tag:
<script src="https://cdn.jsdelivr.net/npm/chartjs-plugin-dragdata@2.0.2/dist/chartjs-plugin-dragdata.min.js"></script>
Or, download a release archive file from the dist folder.
The following Chart.js sample configuration displays (most) of the available
configuration options of the dragdata plugin.
const draggableChart = new Chart(ctx, {
  type: 'line',
  data: {
    labels: ["Red", "Blue", "Yellow", "Green", "Purple", "Orange"],
    datasets: [{
      label: '# of Votes',
      data: [12, 19, 3, 5, 2, 3],
      fill: true,
      tension: 0.4,
      borderWidth: 1,
      pointHitRadius: 25 // for improved touch support
      // dragData: false // prohibit dragging this dataset
                         // same as returning `false` in the onDragStart callback
                         // for this datsets index position
    }]
  },
  options: {
    plugins: {
      dragData: {
        round: 1, // rounds the values to n decimal places
                  // in this case 1, e.g 0.1234 => 0.1)
        showTooltip: true, // show the tooltip while dragging [default = true]
        // dragX: true // also enable dragging along the x-axis.
                       // this solely works for continous, numerical x-axis scales (no categories or dates)!
        onDragStart: function(e, element) {
          /*
          // e = event, element = datapoint that was dragged
          // you may use this callback to prohibit dragging certain datapoints
          // by returning false in this callback
          if (element.datasetIndex === 0 && element.index === 0) {
            // this would prohibit dragging the first datapoint in the first
            // dataset entirely
            return false
          }
          */
        },
        onDrag: function(e, datasetIndex, index, value) {
          /*
          // you may control the range in which datapoints are allowed to be
          // dragged by returning `false` in this callback
          if (value < 0) return false // this only allows positive values
          if (datasetIndex === 0 && index === 0 && value > 20) return false
          */
        },
        onDragEnd: function(e, datasetIndex, index, value) {
          // you may use this callback to store the final datapoint value
          // (after dragging) in a database, or update other UI elements that
          // dependent on it
        },
      }
    },
    scales: {
      y: {
        // dragData: false // disables datapoint dragging for the entire axis
      }
    }
  }
})
Minimum and maximum allowed data values can also be specified through the min and max ticks settings in the scales options. By setting these values accordingly, unexpected (fast) changes to the scales, that may occur when dragging data points towards the outer boundaries of the y-axis, can be prohibited.
const myChartOptions = {
  type: 'line', // or radar, bar, horizontalBar, bubble
  data: {...},
  options: {
    plugins: {dragData: true},
    scales: {
      y: {
        max: 25,
        min: 0
      }
    }
  }
}
In some scenarios, one might want to stop dragging at the closest (rounded) value, or even at a fixed value.
This may be achieved by specifying a magnet callback function
in the plugins settings:
const myChartOptions = {
  type: 'line', // or radar, bar, bubble
  data: {...},
  options: {
    plugins: {
      dragData: {
        magnet: {
    		    to: Math.round // to: (value) => value + 5
        }
      }
    }
  }
}
In order to support touch events, the pointHitRadius option should be set to a value greater than 25. You can find working example configurations in the docs/*.html files. Also note, that mobile devices (and thus touch events) can be simulated with the device mode in the Chrome DevTools.
When working with a module bundler (e.g. Rollup/Webpack) and a framework (e.g. Vue.js/React/Angular), you still need to import the plugin library after installing. Here's a small example for a Vue.js component
<template>
  <div>
    <canvas id="chart"></canvas>
  </div>
</template>
<script>
import Chart from 'chart.js'
// load the options file externally for better readability of the component.
// In the chartOptions object, make sure to add "dragData: true" etc.
import chartOptions from '~/assets/js/labour.js'
import 'chartjs-plugin-dragdata'

export default {
  data() {
    return {
      chartOptions
    }
  },
  mounted() {
    this.createChart('chart', this.chartOptions)
  },
  methods: {
    createChart(chartId, chartData) {
      const ctx = document.getElementById(chartId)
      const myChart = new Chart(ctx, {
        type: chartData.type,
        data: chartData.data,
        options: chartData.options,
      })
    }
  }
}
</script>
<style>
</style>
Please feel free to submit an issue or a pull request!
If you make changes to the src/index.js file, don't forget to npm run build and
manually test your changes against all demos in the docs folder.
chartjs-plugin-dragdata.js is available under the MIT license.
FAQs
Draggable data points for Chart.js
The npm package chartjs-plugin-dragdata receives a total of 9,823 weekly downloads. As such, chartjs-plugin-dragdata popularity was classified as popular.
We found that chartjs-plugin-dragdata demonstrated a healthy version release cadence and project activity because the last version was released less than a year ago. It has 0 open source maintainers collaborating on the project.
Did you know?

Socket for GitHub automatically highlights issues in each pull request and monitors the health of all your open source dependencies. Discover the contents of your packages and block harmful activity before you install or update your dependencies.

Security News
The UK is proposing a bold ban on ransomware payments by public entities to disrupt cybercrime, protect critical services, and lead global cybersecurity efforts.

Security News
Snyk's use of malicious npm packages for research raises ethical concerns, highlighting risks in public deployment, data exfiltration, and unauthorized testing.

Research
Security News
Socket researchers found several malicious npm packages typosquatting Chalk and Chokidar, targeting Node.js developers with kill switches and data theft.