Research
Security News
Malicious npm Packages Inject SSH Backdoors via Typosquatted Libraries
Socket’s threat research team has detected six malicious npm packages typosquatting popular libraries to insert SSH backdoors.
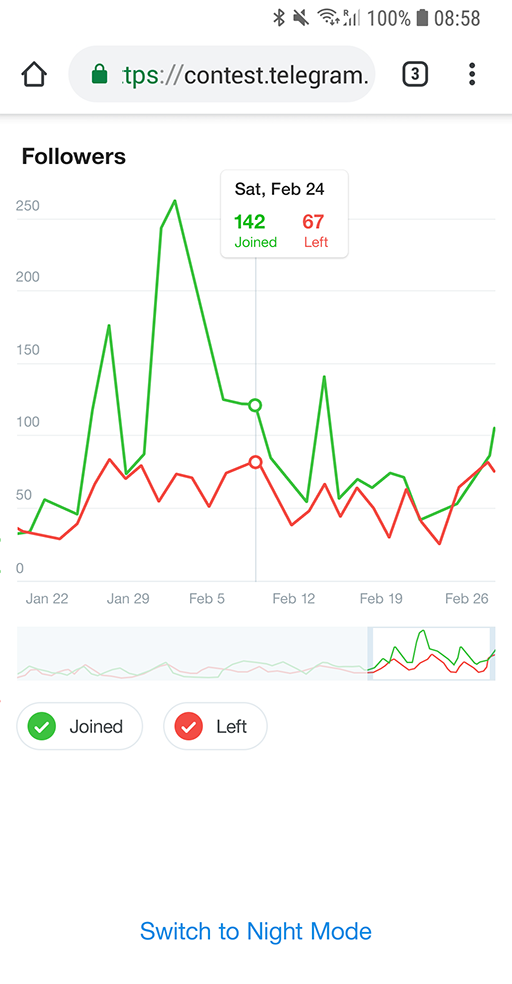
chartogram
Advanced tools
Charts in JS with no dependencies.
Originally created as part of Telegram Charts Contest.


The default exported function takes four arguments:
options.Chart data must have shape:
{
  x: {
    points: Number[]
  },
  y: {
    id: string,
    name: string,
    points: Number[]
  }[]
}
So there must be a single x and one or more ys.
Example:
{
  x: {
    points: [
      1553769000,
      1553770000,
      1553771000
    ]
  },
  y: [
    {
      id: 'y1',
      name: 'Temperature',
      points: [
        60,
        69,
        65
      ]
    },
    {
      id: 'y2',
      name: 'CPU load',
      points: [
        95,
        98,
        90
      ]
    }
  ]
}
The default exported function returns another function which must be called in case of "destroying" the chart (it cleans up global event listeners and resets the DOM node).
<!DOCTYPE html>
<html>
  <head>
    <script src="https://unpkg.com/chartogram@[version]/bundle/chartogram.js"></script>
    <link rel="stylesheet" href="https://unpkg.com/chartogram@[version]/style.css"/>
  </head>

  <body>
    <section id="chart"></section>
    <script>
      chartogram(document.getElementById('chart'), data, 'Title')
    </script>
  </body>
</html>
where [version] is an npm package version range (for example, 0.1.x or ^0.1.0).
npm install chartogram --save
import React from 'react'
import PropTypes from 'prop-types'
import chartogram from 'chartogram'
import 'chartogram/style.css'

class Chartogram extends React.Component {
  static propTypes = {
    data: PropTypes.shape({
      x: PropTypes.shape({
        points: PropTypes.arrayOf(PropTypes.number).isRequired
      }).isRequired,
      y: PropTypes.arrayOf(PropTypes.shape({
        id: PropTypes.string.isRequired,
        name: PropTypes.string.isRequired,
        points: PropTypes.arrayOf(PropTypes.number).isRequired
      })).isRequired
    }).isRequired,
    title: PropTypes.string.isRequired
  }

  node = React.createRef()

  componentDidMount() {
    const { data, title } = this.props
    this.cleanUp = chartogram(this.node.current, data, title)
  }

  componentWillUnmount() {
    this.cleanUp
  }

  render() {
    return <section ref={this.node}/>
  }
}
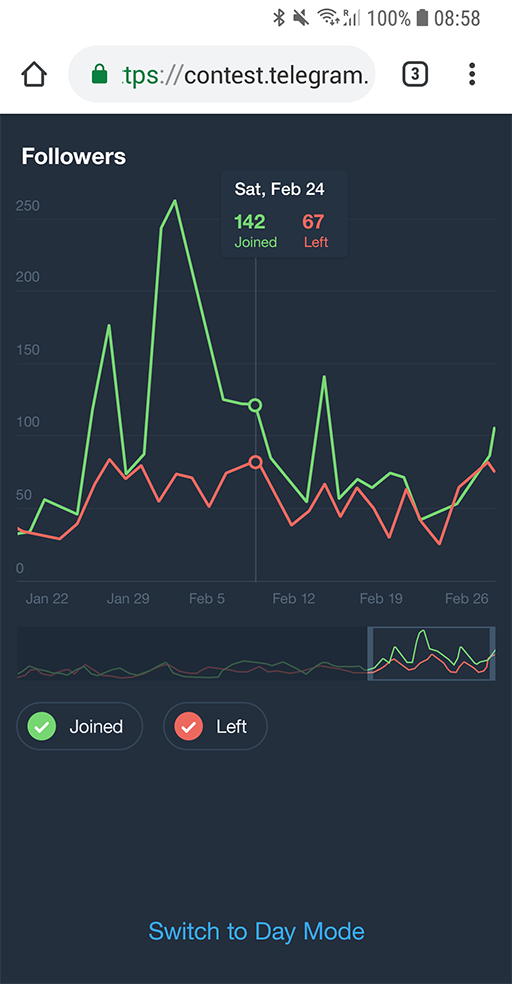
Add chartogram--night-mode CSS class to the chart <section/> to switch to Night Mode.
formatX(value: number, { long: boolean }) — Formats X axis labels. long option is for the tooltip. Uses Intl.DateTimeFormat by default.formatY(value: number) — Formats Y axis labels (including tooltip). Uses Intl.NumberFormat by default.locale: string — Is used to format dates (the default system locale is used if none supplied).transitionDuration: number — The maximum transition duration (in milliseconds).transitionEasing: string — Is easeOutQuad by default.yAxisTickMarksCount: number — Y axis tick marks count.yAxisPrecision: number — Y axis tick mark labels rounding precision: the number of fraction digits to use when formatting Y axis labels. Is 0 by default.xAxisTickMarkWidth: number — (in pixels) Is used to calculate the count of X axis tick marks based on canvas width (in pixels).canvasWidth: number — SVG viewBox width (not pixels).precision: number — SVG coordinates rounding precision.timelineWindowSize: number — The initial size of timeline window (in points).To customize colors override the CSS variables:
body {
	--content-color: black;
	--background-color: white;
	--night-mode-transition-duration: 300ms;
}

.night-mode {
	--background-color: rgb(36,47,62);
	--content-color: white;
}

.chartogram {
	--chartogram-background-color: var(--background-color);
	--chartogram-content-color: var(--content-color);
	--chartogram-night-mode-transition-duration: var(--night-mode-transition-duration);
	/* See `style.css` for the list of all available CSS variables. */
	--chartogram-font-size: 16px;
	--chartogram-tooltip-background-color: white;
}

.chartogram--night-mode {
	/* See `style.css` for the list of all available CSS variables. */
	--chartogram-tooltip-background-color: #293544;
}
Tested in Chrome, Firefox, Microsoft Edge, Internet Explorer 11 and iOS Safari.
The styles use CSS variables which are supported in all browsers except Internet Explorer that would require using something like PostCSS with a plugin like postcss-custom-properties or postcss-css-variables.
Internet Explorer would also require the following polyfills:
FAQs
Charts in JS with no dependencies
We found that chartogram demonstrated a not healthy version release cadence and project activity because the last version was released a year ago. It has 1 open source maintainer collaborating on the project.
Did you know?

Socket for GitHub automatically highlights issues in each pull request and monitors the health of all your open source dependencies. Discover the contents of your packages and block harmful activity before you install or update your dependencies.

Research
Security News
Socket’s threat research team has detected six malicious npm packages typosquatting popular libraries to insert SSH backdoors.

Security News
MITRE's 2024 CWE Top 25 highlights critical software vulnerabilities like XSS, SQL Injection, and CSRF, reflecting shifts due to a refined ranking methodology.

Security News
In this segment of the Risky Business podcast, Feross Aboukhadijeh and Patrick Gray discuss the challenges of tracking malware discovered in open source softare.