chartogram
Charts in JS with no dependencies.
DEMO
Originally created as part of Telegram Charts Contest.
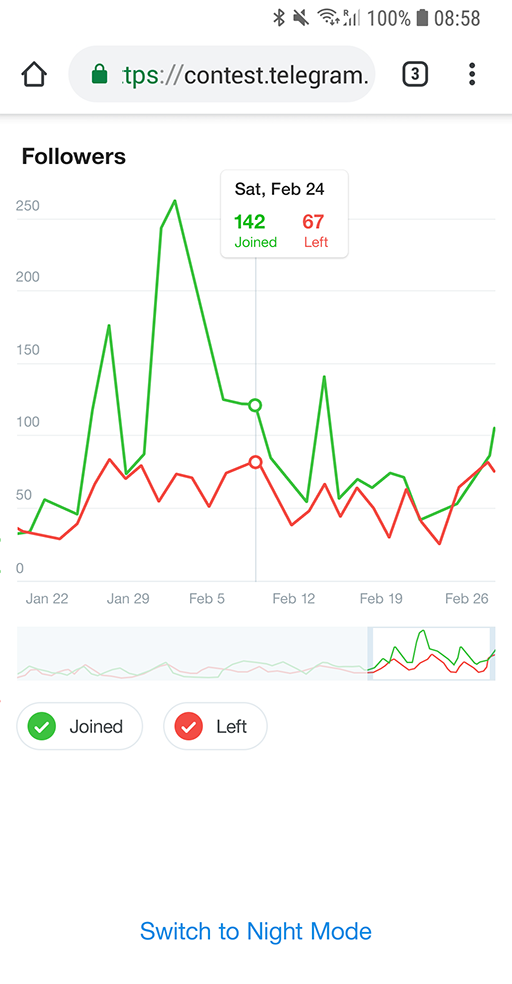
Screenshots
Day
View in full resolution
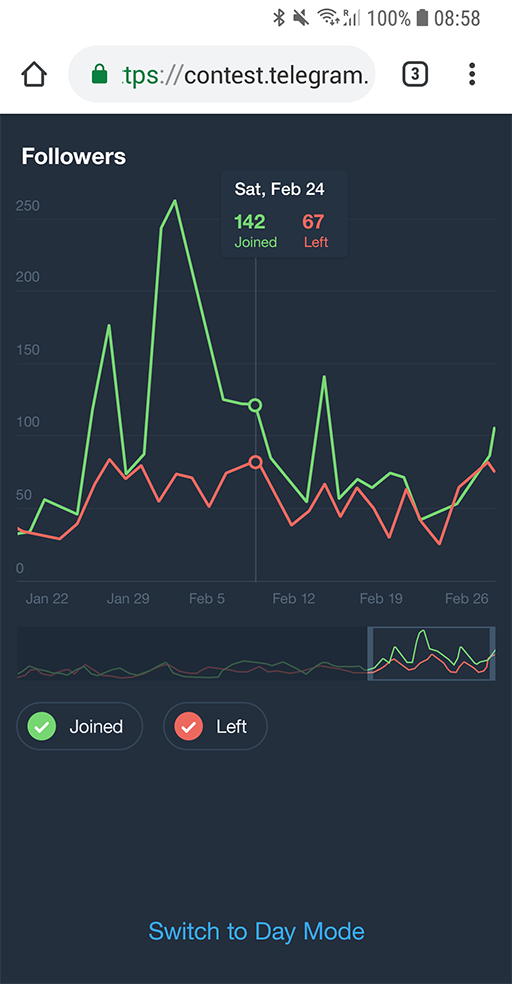
Night
View in full resolution
Use
The default exported function takes three arguments:
- The DOM element where the chart will be rendered.
- Chart data.
- Chart title.
Chart data must have shape:
{
x: {
points: Number[]
},
y: {
id: string,
name: string,
points: Number[]
}[]
}
So there must be a single x and one or more ys.
Example:
{
  x: {
    points: [
      1553769000,
      1553770000,
      1553771000
    ]
  },
  y: [
    {
      id: 'y1',
      name: 'Temperature',
      points: [
        60,
        69,
        65
      ]
    },
    {
      id: 'y2',
      name: 'CPU load',
      points: [
        95,
        98,
        90
      ]
    }
  ]
}
Browser
<!DOCTYPE html>
<html>
  <head>
    <script src="https://unpkg.com/chartogram@[version]/bundle/chartogram.js"></script>
    <link rel="stylesheet" href="https://unpkg.com/chartogram@[version]/style.css"/>
  </head>

  <body>
    <section id="chart"></section>
    <script>
      chartogram(document.getElementById('chart'), data, 'Title')
    </script>
  </body>
</html>
where [version] is an npm package version range (for example, 0.1.x or ^0.1.0).
React
npm install chartogram --save
import React from 'react'
import PropTypes from 'prop-types'
import chartogram from 'chartogram'
import 'chartogram/style.css'
class Chartogram extends React.Component {
static propTypes = {
data: PropTypes.shape({
x: PropTypes.shape({
points: PropTypes.arrayOf(PropTypes.number).isRequired
}).isRequired,
y: PropTypes.arrayOf(PropTypes.shape({
id: PropTypes.string.isRequired,
name: PropTypes.string.isRequired,
points: PropTypes.arrayOf(PropTypes.number).isRequired
})).isRequired
}).isRequired,
title: PropTypes.string.isRequired
}
node = React.createRef()
componentDidMount() {
const { data, title } = this.props
chartogram(this.node.current, data, title)
}
componentWillUnmount() {
}
render() {
return <section ref={this.node}/>
}
}
Night mode
Add chartogram--night-mode CSS class to the chart <section/> to switch to Night Mode.
Custom colors
To customize colors override the CSS variables:
body {
--content-color: black;
--background-color: white;
--night-mode-transition-duration: 300ms;
}
.night-mode {
--background-color: rgb(36,47,62);
--content-color: white;
}
.chartogram {
--chartogram-background-color: var(--background-color);
--chartogram-content-color: var(--content-color);
--chartogram-night-mode-transition-duration: var(--night-mode-transition-duration);
--chartogram-font-size: 16px;
--chartogram-tooltip-background-color: white;
}
.chartogram--night-mode {
--chartogram-tooltip-background-color: #293544;
}
Browser compatibility
Tested in Chrome, Firefox and iOS Safari.
Won't work in Edge or Internet Explorer.
The styles use CSS variables which work everywhere except Internet Explorer.


