dc-tableview
dc-tableview is an interactive chart for dc.js library that presents data in tableview form.
It was created because I was missing some functionality in the original table that comes with dc. I designed it so that it can easily replace dc.dataTable in your projects.
It is build on top of well known DataTables jQuery plugin
Table of contents
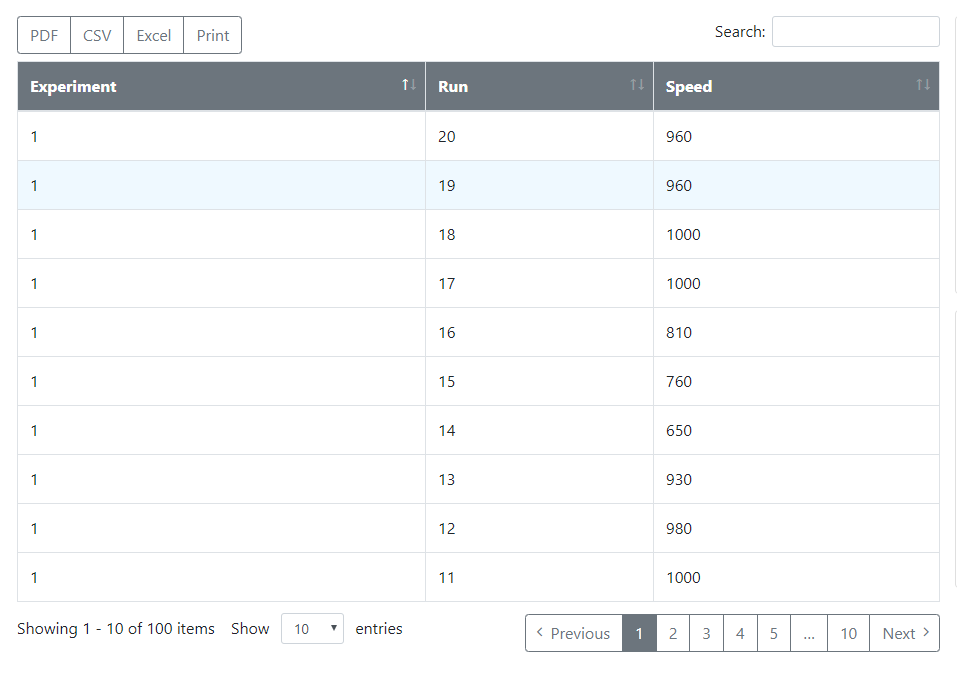
Screenshots
Quick start
Several quick start options are available:
Download the latest build
Development, unminified code
Production, minified code
Install from Bower
bower install dc-tableview --save
Install from Npm
npm install dc-tableview --save
Using Git repository
To clone the repository, use
git clone https://github.com/karenpommeroy/dc-tableview.git
Build sources
grunt build
Done!
Usage
This library is created as an UMD module which means you can use it as an AMD or CommonJS module as well as a standalone library.
Include as a module (require.js):
require("dc-tableview");
dc.tableview(div, "chartGroupName");
Including files (standalone):
<script src="/path/to/dc-tableview.js"></script>
<script>
	dc.tableview.doSomething();
</script>
Dependencies:
There are couple of dependencies that are required by dc-tableview.
Two libraries are essential for every build: dc.js and jquery
Bootstrap.js is required if you are going to use bootstrap ready version.
In order to run the examples you also need to include d3.js and crossfilter2
Initialization
Initialization is performed the same as for any other chart in dc.js:
var chart = dc.tableview(div, "chartGroupName");
Methods
dc-tableview is written so that it can replace standard data table included in dc without any big changes in existing code.
It mixes in dc.baseMixin and implements all of the methods of the original dc.dataTable.
Initialization looks like this:
var chart = dc.tableview(".chart .container", "chartGroupName");
int beginSlice(int index)
Get or set the index of the beginning slice which determines which entries get displayed by the widget. Useful when implementing pagination. See: https://dc-js.github.io/dc.js/docs/html/dc.dataTable.html#beginSlice
var slice = chart.beginSlice();
chart.beginSlice(5);
void buttons(Array buttons)
Get or set buttons available for the chart.
chart.buttons(["csv", "pdf", "excel", "print"])
clean()
Removes tableview from DOM.
chart.clean();
void columns(string appId)
Gets or sets column definitions to be used. For details check out: https://datatables.net/reference/option/columns
chart.columns([
    { title: "Experiment", data: "Expt" },
    { title: "Run", data: "Run" },
    { title: "Speed", data: "Speed" },
]);
object dataSource(object source)
Get or set dataSource to be be used for the table.
By default dataSource is obtained based on dimension however you can supply your own data independently.
See details here: https://datatables.net/manual/data/#Data-sources
chart.dataSource({});
void dom(string content)
Get or set order of chart components. Described in details here: https://datatables.net/reference/option/dom
chart.dom("Bftip");
bool enableAutoWidth(bool enable)
Get status or enable/disable automatic column width calculation.
chart.enableAutoWidth(true);
bool enableColumnReordering(bool enable)
Get status or enable/disable reordering of columns.
chart.enableColumnReordering(true);
Get status or set whether to show or hide header row.
chart.enableHeader(true);
bool enablePaging(bool enable)
Get status or enable/disable paging.
chart.enablePaging(true);
bool enablePagingInfo(bool enable)
Get status or enable/disable paging info text.
chart.enablePagingInfo(true);
bool enablePagingSizeChange(bool enable)
Get status or enable/disable paging size change combo box.
chart.enablePagingSizeChange(true);
bool enableSearch(bool enable)
Get status or enable/disable search (filter) input.
chart.enableSearch(true);
void endSlice(int slice)
Get or set the index of the end slice which determines which entries get displayed by the widget.
See: https://dc-js.github.io/dc.js/docs/html/dc.dataTable.html#endSlice
tableview.endSlice();
Enable or disable fixed header that will be always visible.
chart.fixedHeader(true);
object getDataTable()
Returns underlying DataTable object for advanced manipulation.
For more info checkout DataTables repository (https://github.com/DataTables/Dist-DataTables) and documentation.
var dt = chart.getDataTable();
string groupBy(string columnName)
Get or set column name that the grouping should be applied by.
chart.groupBy("id");
object listeners(object listeners)
Attach event handlers to chart.
chart.listeners({
    rowClicked: function (row, data, index) {
    },
    rowDblClicked: function (row, data, index) {
    },
    rowEnter: function (row, data, index) {
    },
    rowLeave: function (row, data, index) {
    }
});
void order(string appId)
Gets or sets default sort type used in the chart. This will be used if order is not specified using sortBy() function.
chart.order("asc");
string pagingInfoText(string text)
Get or set text used by pagin info control.
You can use following placeholders here that will be replaced by actual values: START, END, TOTAL;
chart.pagingInfoText("Showing _START_ - _END_ of _TOTAL_ items");
string rowId(string fieldName)
Get or set the name of the column that will be used as row id
chart.rowId(id");
string scrollY(string size)
Get or set the value for height at which scroll should be visible.
chart.scrollY("250px");
void showGroups (bool show)
Get current status or enable/disable data grouping. This must be enabled in order for groupBy() to work
chart.showGroups(true);
int size(int size)
Get or set the table size which determines the number of rows displayed.
var size = chart.size();
chart.size(25)
Array sortBy(Array sortDefinitions)
Get or set fields that data is sorted by along with sort order. Multiple sorts are allowed at the same time.
chart.sortBy([["first", "desc"], ["second", "asc"]]);
Chaining
All of the exposed methods return dc-tableview object so chaining subsequent calls is possible.
An example of this would be:
var chart = dc.tableview(".container", "name");
chart.enableHeader(false)
.fixedHeader(true)
.enableAutoWidth(true)
.rowId("id")
Examples
Click one of the links below to see dc-tableview in action:
All of above examples are available in the examples folder located in the repository.
Copyright and license
Licensed under MIT license.
^ back to top


