Research
Security News
Malicious npm Package Targets Solana Developers and Hijacks Funds
A malicious npm package targets Solana developers, rerouting funds in 2% of transactions to a hardcoded address.
ember-user-performance-monitoring
Advanced tools
Use this addon to add performance timing to your Ember application. It does not deal with sending data out of your application, but lets you set up event listeners on timing events, which you can use to integrate with a metric collecting tool of your choice.
One of it's features is it's use of PerformanceObserver and the ability to measure pre-application boot events by injecting the code into your apps HEAD (optionally. depending on what config settings you've added). This data is saved as window variables and then 'emitted' as events when you eventually call listen() on the service.
ember install ember-user-performance-monitoring
Once installed, you'll need to add event listeners to the provided userPerformanceMonitoring service and then call
.listen once all listeners are attached.
You can call this anywhere, but listen should be called once.
For example, adding it to the application routes init():
// app/routes/application.js
import { inject as service } from '@ember/service';
import Route from '@ember/routing/route';

export default Route.extend({
  userPerformanceMonitoring: service(),

  init() {
    this.initUserPerformance();
  },

  async initUserPerformance() {
    this.userPerformanceMonitoring.on('timingEvent', (eventName, eventDetails, additionalDetails) => {
      // console.log(eventName, eventDetails)
      // Other details:
      // const { currentURL } = additionalDetails;
      // const { load } = additionalDetails;
      // const { connection } = additionalDetails;
      // const { assetTimings } = additionalDetails;
    });
    this.userPerformanceMonitoring.listen();
  }
});
You can time any assets that get loaded during the start of your app by using the following config:
ENV['ember-user-performance-monitoring'] = {
  includeAssetTimings: true,
  assetTimingOptions: {
    watchedAssets: {
      app_js: {
        matches: 'assets/app.*js$'
      },
      app_css: {
        matches: 'assets/app.*css$'
      },
      vendor_js: {
        matches: 'assets/vendor.*js$'
      },
      vendor_css: {
        matches: 'assets/vendor.*css$'
      }
    }
  }
This will match any resource names against the provided regex and provide timings using the name (eg. app_js) when the paint event fires as additional details (so you can record asset timing in conjunction with DCLor TTI).
This hooks into the runloop to time transitions in your app, and can also time rendering (optionally, depending on the inclusion of a component at the end of your template).
ENV['ember-user-performance-monitoring'] = {
  watchTransitions: true,
  enablePerformanceMeasures: true // not necessary but helpful for debugging
}
Then, all transitions will automatically be caught via the router microlib. Transition time includes normalizeResponse and setupController.
If you wish to capture render time for the page as well, putting {{render-performance-monitor}} at the bottom of target routes uses didRender and then puts a timing at the end of the destroy queue, to offer lightweight approximate render times for the initial render of the page.
Then you can listen on timingEvent on the performance service.
// app/routes/application.js
import { inject as service } from '@ember/service';
import Route from '@ember/routing/route';

export default Route.extend({
  userPerformanceMonitoring: service(),

  init() {
    this.initUserPerformance();
  },

  async initUserPerformance() {
    this.userPerformanceMonitoring.on('timingEvent', (eventName, eventDetails, additionalDetails) => {
      /*
      if (eventName === "transitionWithoutRender") {
        console.log(eventDetails);
      }

      if (eventName === "transitionRender") {
        console.log(eventDetails);
      }
      */
    });
    this.userPerformanceMonitoring.listen();
  }
});
Result (for transitionWithRender):
{
  from: "homepage.index"
  to: "posts.list"
  render: 316
  renderCount: 2
  renderToCount: 5
  transition: 445
  transitionCount: 2
  transitionNumber: 10
  transitionToCount: 5
}
Breakdown:
from and to describe the transitionrender and transition are the times for those stages, in millisecondsrenderCount and transitionCount are the count of times this specific transition has been hit. (useful for pre-fetch or reuse between specific routes).renderToCount and transitionToCount are the count of times this page has been transitioned to (useful for generic background reload performance checks)The following lists the load metrics measured by this addon:
Additional data collected that can be sent back:
See the Contributing guide for details.
This project is licensed under the MIT License.
FAQs
Adds performance timing to your Ember application
We found that ember-user-performance-monitoring demonstrated a not healthy version release cadence and project activity because the last version was released a year ago. It has 1 open source maintainer collaborating on the project.
Did you know?

Socket for GitHub automatically highlights issues in each pull request and monitors the health of all your open source dependencies. Discover the contents of your packages and block harmful activity before you install or update your dependencies.

Research
Security News
A malicious npm package targets Solana developers, rerouting funds in 2% of transactions to a hardcoded address.

Security News
Research
Socket researchers have discovered malicious npm packages targeting crypto developers, stealing credentials and wallet data using spyware delivered through typosquats of popular cryptographic libraries.

Security News
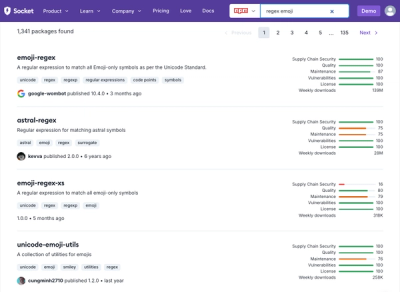
Socket's package search now displays weekly downloads for npm packages, helping developers quickly assess popularity and make more informed decisions.