g-chartframe
0.2.0 Relese notes: The default frame types are now made by functions rather than provided as constants.
allow for bulk setting of attributes
For making the boring but necessary stuff on D3 charts in as painless a fashion as possible.
Installation
If you use NPM, npm install @financial-times/g-chartframe(er... not yet!). Otherwise, download the latest release.
Use
Preconfigured frames...
const webframe = gChartframe.webFrame();
webframe.title('A simple chart')
	.subtitle('showing some interesting things')
	.source('source: FT research|FT Graphic Tom Pearson');

d3.select('.web-chart-container svg')
	.call(webframe);

webframe.plot()
	...add your visualisation code here...
Configure your own frame...
const myFrame = gChartframe.frame()
	.width(350)
	.height(350)
	.margin({top:20,left:20,bottom:20,right:20,})
	.title('My totally custom title')
	.subtitle('hello hello hello')

d3.select('.custom-chart-container')
	.append('svg')
	.call(myFrame);
You may also set frame properties en-masse via the attrs function. Though note: if you're relying on setting units you should do so before calling attrs as you can't guarantee in which order the setters will be called.
myFrame.attrs({
  title:'A different title',
  subtitle:'A different subtitle',
  width:600,
  ...etc
})
API Reference
#frame([configuration])
Make a new chart frame drawer:
const myFrame = gChartframe.frame();
configuration is an optional parameter which sets the initial properties of the frame via the setter functions as defined below.
e.g.
const config = {
  title:'The fastest cars in the world',
  subtitle:'acceleration m/s<sup>2</sup>',
  source:'Guiness book of records',
}

const myFrame = gChartframe.frame(config);
Most of the time you won't want to use this though but instead use one of the pre configured chartframe factories...
const myFrame = gChartframe.webFrame(config);
or...
const myFrame = gChartframe.printFrame(config);
or...
const myFrame = gChartframe.socialFrame(config);
or...
const myFrame = gChartframe.videoFrame(config);
these provide appropriate positioning, size and fonts for the specified use within the FT (web, print, social media or video)
#frame.attrs(object)
A convenience setter: Set as many values as you choose by passing a big object to the frame (see above).
#frame.backgroundColour(string)
Set the background colour of the frame. For the single argument you can use the same css color naming schemes that you use in HTML, whether that's color names (that is red), rgb values (that is rgb(255,0,0)), hex values, rgba values, etc. If no argument is specified returns the current value.
myFrame.backgroundColour('#00FF00');
#frame.containerClass(string)
Set the class assigned to the containing SVG element. This allows you to select the frame later and to define CSS styles pertaining only to its contents. If no argument is specified returns the current value.
myFrame.containerClass('special-frame');
would allow you to target the frames contents in your CSS like this...
.special-frame line{
	stroke-width:2;
	stroke:#00FF00;
	stroke-opacity:0.5;
	fill:none;
}
#frame.dimension()
This returns an object with the height and width of the suggested plot area. This is useful for determining the range of scales.
If no argument is specified returns the current value.
const dimension = myFrame.dimension();
const horizontalScale = d3.linearScale()
.range([0, dimension.width]);
const verticalScale = d.lineaScale()
.range([dimension.height, 0]);
#frame.height(number)
Set the height for the frames container (typically be an SVG).
If no argument is specified returns the current value.
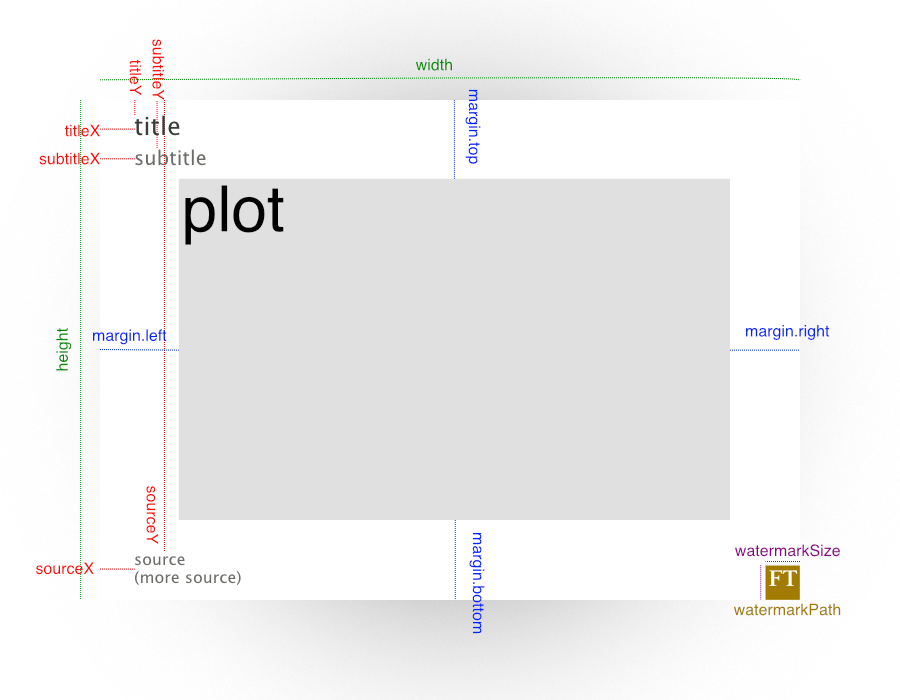
#frame.margin([{[top:number], [left:number], [bottom:number], [right:number],}])
Set the margins for the frame follwing the D3 margin convention.
If no argument is specified returns the current value.
#frame.plot()
This returns a d3 selection of the frames plot group. This is where the graphical elements of the chart can be appended.
const plot = myFrame.plot();

plot.selectAll('rect')
	.data(theData)
	.enter()
	.append('rect')
	...
#frame.source([string])
A string describes the source of the graphic's data, line breaks can be added with the | character. The property can also be used to add notes, credits etc. If no argument is specified returns the current value.
myFrame.source('Source:FT Research|Graphic: Pam Ampersand');
#frame.sourceLineHeight([number])
Set the line height for the graphic's source text. If no argument is specified returns the current value.
#frame.sourceStyle([{attribute:value}])
Set the appearnce of the graphic's source text. A series of attributes are added to the text element with the specified values. If no argument is specified returns the current value.
myFrame.sourceStyle({
	'font-family':'Sans-serif, Helvetica',
	'fill':'#00FF00';
	...
});
will result in a text element that looks like...
<text class="chart-source"><tspan y="477" x="4" font-family="Sans-serif, Helvetica" fill="#00FF00">Source text</tspan></text>
#frame.sourceX([number])
Set the X translation of the graphic's source text. If no argument is specified returns the current value.
#frame.sourceY([number])
Set the Y translation of the graphic's source text. If no argument is specified returns the current value.
#frame.subtitle([string]) similar to source
#frame.subtitleLineHeight([number]) similar to sourceLineHeight
#frame.subtitleStyle([{attribute:value}]) similar to sourceStyle
#frame.subtitleX([number]) similar to sourceX
#frame.subtitleY([number]) similar to sourceY
#frame.title([string]) similar to source
#frame.titleStyle([number]) similar to sourceStyle
#frame.titleLineHeight([number]) similar to sourceLineHeight
#frame.titleX([number]) similar to sourceX
#frame.titleY([number]) similar to sourceY
#frame.units([string])
Set the units in which the Height and Width are set. At the moment the only useful argument is 'mm' which allows you to specify height and width in mm -- useful for print. If no argument is specified returns the current value.
#frame.watermark([svgnodes])
The user can supply arbitrary SVG markup as a string. THis will be used as the watermark for the graphic. If no argument is specified returns the current value.
#frame.watermarkLocation([href])
The user can set a URL for a watermark SVG to be used.
#frame.width([number])
Set the height for the frames container (typically be an SVG).
If no argument is specified returns the current value.
👉 Note: If the chart frame is being called on an SVG element the width, height and title functions will re-write those properties of the parent SVG. If you don't want this to happen you can avoid it by calling the function on a group element instead.
--
Copyright (c) 2015, 2016, 2017 Financial Times


