Security News
Bun 1.2 Released with 90% Node.js Compatibility and Built-in S3 Object Support
Bun 1.2 enhances its JavaScript runtime with 90% Node.js compatibility, built-in S3 and Postgres support, HTML Imports, and faster, cloud-first performance.
This is a module for manipulating media elements and for graphics processing.
This is a module for manipulating media elements and for graphics processing.
npm install graphicjs;
There are some examples in "./examples" in this package.Here is the first one to get you started.
import graphicjs from 'graphicjs';

// Actual dimensions of the image
graphicjs.getMediaDimensions(document.querySelector('img'));// { width: 320, height: 240 }

// Actual dimensions of the video
graphicjs.getMediaDimensions(document.querySelector('video'));// { width: 320, height: 240 }
import graphicjs from 'graphicjs';

// Image loading complete status
graphicjs.isMediaLoaded(document.querySelector('img'));// TRUE or FALSE

// Video loading complete status
graphicjs.isMediaLoaded(document.querySelector('video'));// TRUE or FALSE
import graphicjs from 'graphicjs';

// Wait for the image to load.
await graphicjs.awaitMediaLoaded(document.querySelector('img'));

// Wait for the video to load.
await graphicjs.isMediaLoaded(document.querySelector('video'));
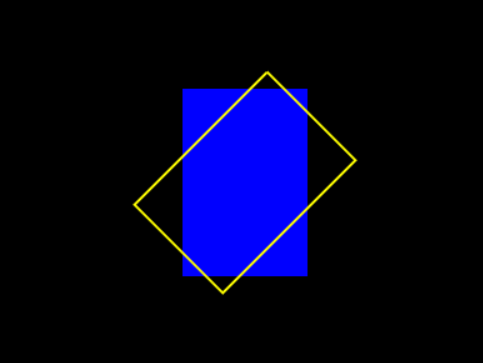
<canvas id="myCanvas" width="400" height="300" style="background: black;"></canvas>

import graphicjs from 'graphicjs';

// Draw a rectangle
const myCanvas = document.querySelector('#myCanvas');
const ctx = myCanvas.getContext('2d');
const x = 150;
const y = 75;
const width = 100;
const height = 150;
    ctx.fillStyle = 'blue';
ctx.fillRect(x, y, width, height);

// Rotated coordinates of the rectangle
const degree = 45;
const coordinates = graphicjs.getRotatedRectCoordinates(x, y, width, height, degree);

// Draw a rotated rectangle
ctx.beginPath();
ctx.moveTo(coordinates[0].x, coordinates[0].y);
ctx.lineTo(coordinates[1].x, coordinates[1].y);
ctx.lineTo(coordinates[2].x, coordinates[2].y);
ctx.lineTo(coordinates[3].x, coordinates[3].y);
ctx.lineTo(coordinates[0].x, coordinates[0].y);
ctx.lineWidth = 2;
ctx.strokeStyle = 'yellow';
ctx.stroke();
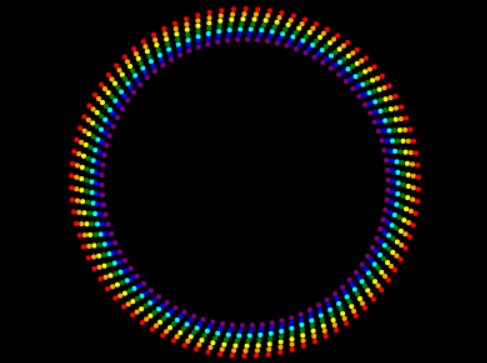
<canvas id="myCanvas" width="400" height="300" style="background: black;"></canvas>

import graphicjs from 'graphicjs';

// Canvas center coordinates
const myCanvas = document.querySelector('#myCanvas');
const cx = parseInt(myCanvas.width, 10) / 2;
const cy = parseInt(myCanvas.height, 10) / 2;

// Draw a point on the circle with the center of the canvas as the origin.
const x = 80;
const y = 80;
const pointColors = [ 'red', 'orange', 'yellow', 'green', 'aqua', 'blue', 'purple' ]
for (let i=0; i<pointColors.length; i++) {
  for (let degree=0; degree<360; degree+=4) {
    const coordinate = graphicjs.getRotationCoordinate(x + i*3, y + i*3, cx, cy , degree);
    graphicjs.drawPoint(myCanvas, coordinate.x, coordinate.y, { radius: 2, color: pointColors[i] });
  }
}
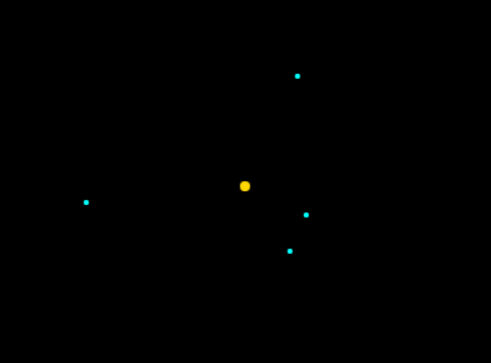
<canvas id="myCanvas" width="400" height="300" style="background: black;"></canvas>

import graphicjs from 'graphicjs';

// Returns a random integer from min to max
function randInt(min, max) {
  min = Math.ceil(min);
  max = Math.floor(max);
  return Math.floor(Math.random() * (max - min)) + min;
}

// Returns random coordinates
function randCoordinates(numberOfCoordinates) {
  const maxX = parseInt(document.querySelector('#myCanvas').width, 10);
  const maxY = parseInt(document.querySelector('#myCanvas').height, 10);
  return [...Array(numberOfCoordinates)].map(_ => ({ x: randInt(1, maxX), y: randInt(1, maxY) }));
}

// Draw multiple points
const myCanvas = document.querySelector('#myCanvas');
const coordinates = randCoordinates(4);
for (let { x, y } of coordinates) graphicjs.drawPoint(myCanvas, x, y, { radius: 2, color: 'cyan' });

// Draw the center point of multiple points
const { x, y } = graphicjs.getCenterCoordinate(...coordinates);
graphicjs.drawPoint(myCanvas, x, y, { radius: 4, color: 'gold' });
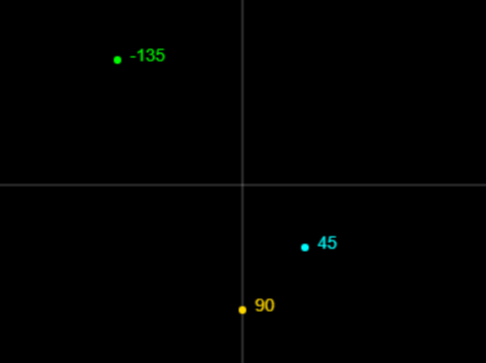
<canvas id="myCanvas" width="400" height="300" style="background: black;"></canvas>

import graphicjs from 'graphicjs';

const myCanvas = document.querySelector('#myCanvas');
const ctx = myCanvas.getContext('2d');
const cx = parseInt(myCanvas.width, 10) / 2;
const cy = parseInt(myCanvas.height, 10) / 2;

// Write the axis
graphicjs.drawLine(myCanvas, 0, cy, parseInt(myCanvas.width, 10), cy, { color: 'white', lineWidth: .5 });
graphicjs.drawLine(myCanvas, cx, 0, cx, parseInt(myCanvas.height, 10), { color: 'white', lineWidth: .5 });

// Draw a point at an angle of 45 degrees from the center
let x = cx + 50;
let y = cy + 50;
graphicjs.drawPoint(myCanvas, x, y, { color: 'aqua' });
let degree = graphicjs.getAngleBetweenCoordinates(cx, cy, x, y);
graphicjs.drawText(myCanvas, degree, x + 10, y - 10, { color: 'aqua' });

// Draw a point at an angle of 90 degrees from the center
x = cx + 0;
y = cy + 100;
graphicjs.drawPoint(myCanvas, x, y, { color: 'gold' });
degree = graphicjs.getAngleBetweenCoordinates(cx, cy, x, y);
graphicjs.drawText(myCanvas, degree, x + 10, y - 10, { color: 'gold' });

// Draw a point at an angle of -135 degrees from the center
x = cx - 100;
y = cy - 100;
graphicjs.drawPoint(myCanvas, x, y, { color: 'lime' });
degree = graphicjs.getAngleBetweenCoordinates(cx, cy, x, y);
graphicjs.drawText(myCanvas, degree, x + 10, y - 10, { color: 'lime' });
import graphicjs from 'graphicjs';

// Distance between coordinates (0, 0) and (200, 150)
graphicjs.getDistance(0, 0, 200, 150);// 250
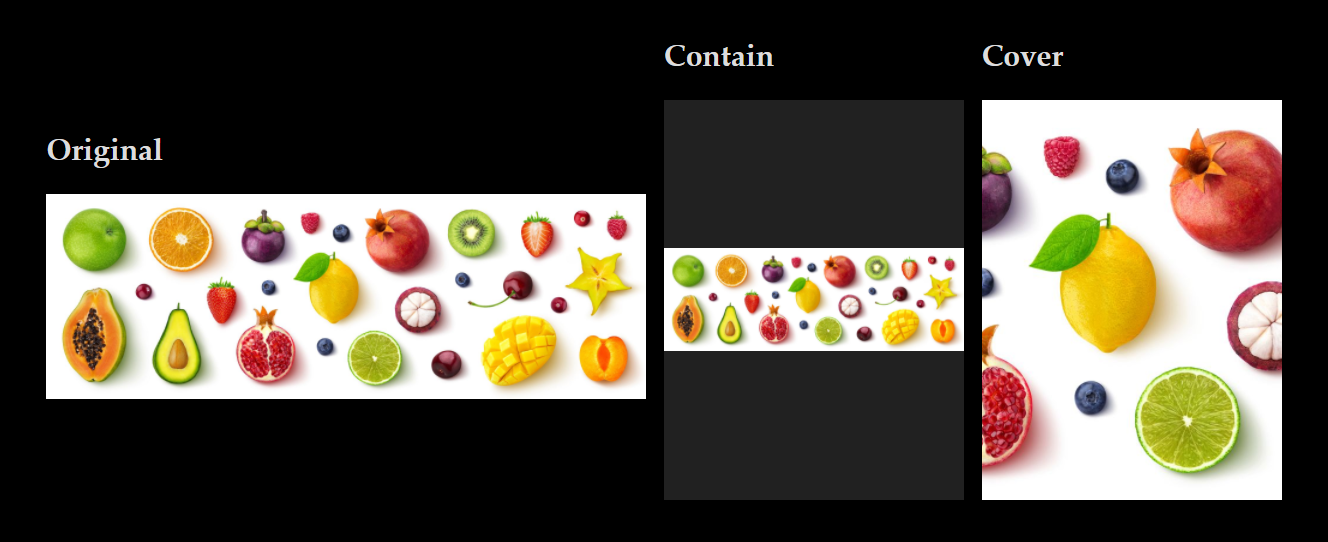
<h1>Original</h1><img src="sample.png">
<h1>Contain</h1><div id="parent1" style="width: 320px; height: 240px;"><img id="img1" src="sample.png"></div>
<h1>Cover</h1><div id="parent2" style="width: 320px; height: 240px;"><img id="img2" src="sample.png"></div>

import graphicjs from 'graphicjs';

// Contain
graphicjs.fitParent(document.querySelector('#img1'), document.querySelector('#parent1'), 'contain');

// Cover
graphicjs.fitParent(document.querySelector('#img2'), document.querySelector('#parent2'), 'cover');
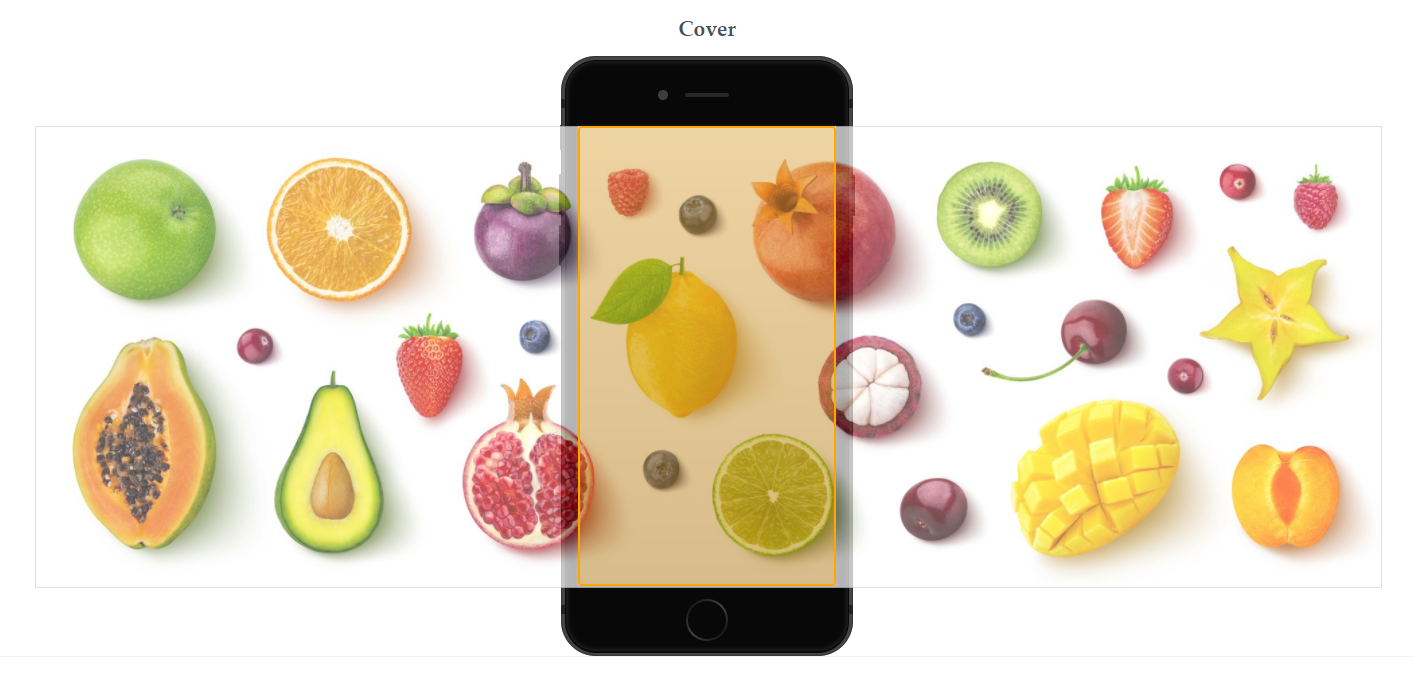
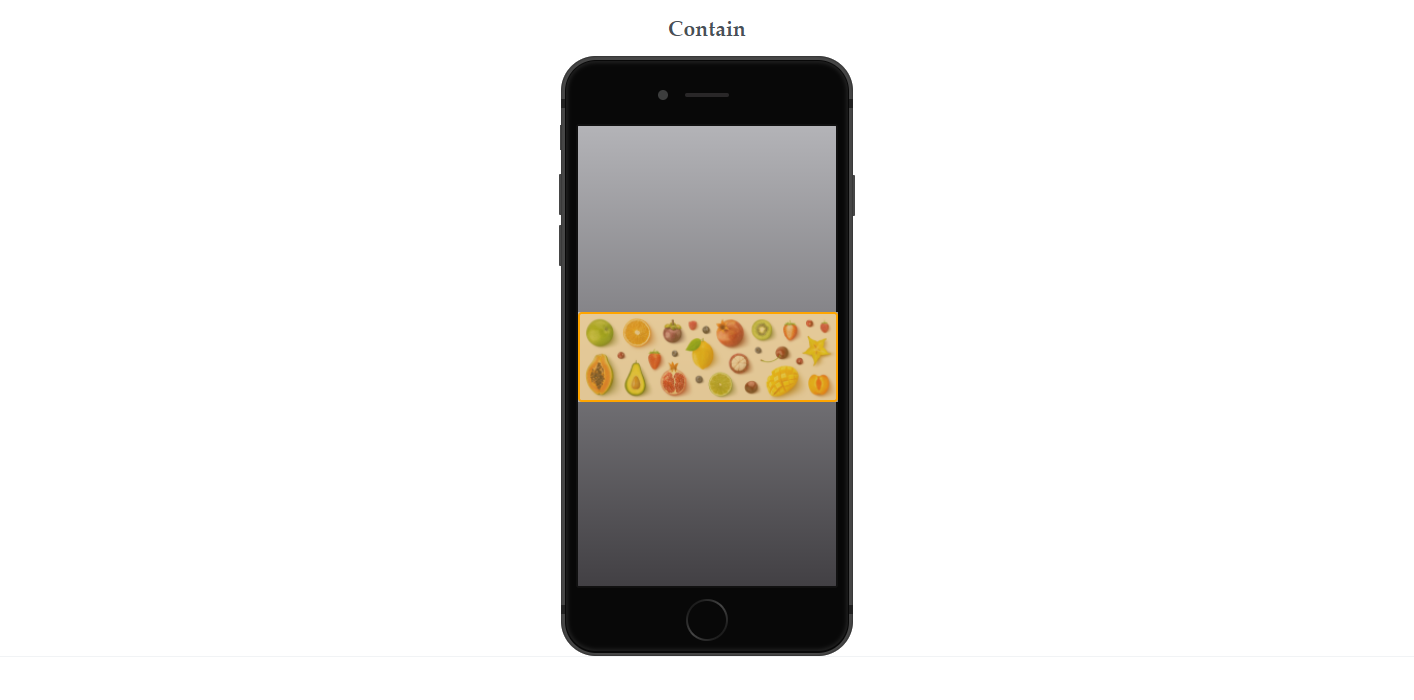
Returns a bounding box for the visible region relative to the actual size of the media.
If the "object-fit" of the media element is "cover", the bounding box points to the orange part of the image below.
Also, if the "object-fit" of the media element is "contain", the bounding box points to the orange part of the image below.
import graphicjs from 'graphicjs';

// Bounding box in the rendering area
graphicjs.getRenderClientRect(document.querySelector('video'));// {"x":743.5,"y":0,"width":513,"height":684}
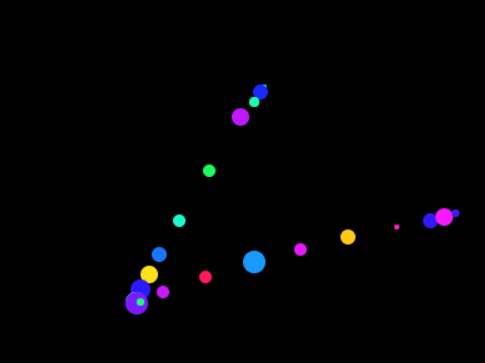
<canvas id="myCanvas" width="400" height="300" style="background: black;"></canvas>

import graphicjs from 'graphicjs';

// Returns a random integer from min to max
function randInt(min, max) {
  min = Math.ceil(min);
  max = Math.floor(max);
  return Math.floor(Math.random() * (max - min)) + min;
}

// Returns a random color
function randColor() {
  return `hsl(${Math.random() * 360}, 100%, 55%)`;
}

// Draw a dot at the coordinates that the mouse passed
const myCanvas = document.querySelector('#myCanvas');
myCanvas.addEventListener('mousemove', e => {
  const radius = randInt(1, 10);
  const color = randColor();
  graphicjs.drawPoint(myCanvas, e.offsetX, e.offsetY, { radius, color });
});
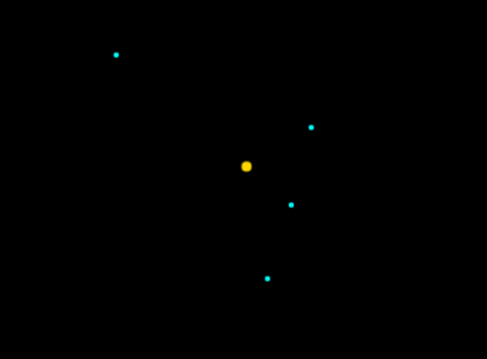
<canvas id="myCanvas" width="400" height="300" style="background: black;"></canvas>

import graphicjs from 'graphicjs';

// Returns a random integer from min to max
function randInt(min, max) {
  min = Math.ceil(min);
  max = Math.floor(max);
  return Math.floor(Math.random() * (max - min)) + min;
}

// Returns random coordinates
function randCoordinates(numberOfCoordinates) {
  const maxX = parseInt(document.querySelector('#myCanvas').width, 10);
  const maxY = parseInt(document.querySelector('#myCanvas').height, 10);
  return [...Array(numberOfCoordinates)].map(_ => ({ x: randInt(1, maxX), y: randInt(1, maxY) }));
}

// Draw multiple points
const myCanvas = document.querySelector('#myCanvas');
const coordinates = randCoordinates(4);
for (let { x, y } of coordinates) graphicjs.drawPoint(myCanvas, x, y, { radius: 2, color: 'cyan' });

// Draw the center point of multiple points
graphicjs.drawCenterPoint(myCanvas, coordinates, { radius: 4, color: 'gold' });
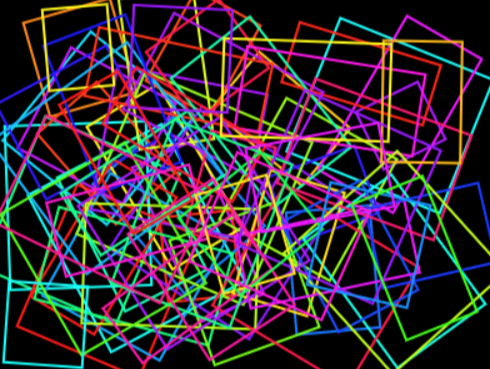
<canvas id="myCanvas" width="400" height="300" style="background: black;"></canvas>

import graphicjs from 'graphicjs';

// Returns a random color
function randColor() {
  return `hsl(${Math.random() * 360}, 100%, 55%)`;
}

// Returns a random integer from min to max
function randInt(min, max) {
  min = Math.ceil(min);
  max = Math.floor(max);
  return Math.floor(Math.random() * (max - min)) + min;
}

// Draw a rectangle
const myCanvas = document.querySelector('#myCanvas');
const canvasWidth = parseInt(myCanvas.width, 10);
const canvasHeight = parseInt(myCanvas.height, 10);
for (let i=0; i<70; i++) {
  const width = randInt(50, 150);
  const height = randInt(50, 150);
  const x = randInt(0, canvasWidth - width);
  const y = randInt(0, canvasHeight - height);
  const lineColor = randColor();
  const degree = randInt(0, 360);
  graphicjs.drawRectangle(myCanvas, x, y, width, height, { lineColor, degree });
}
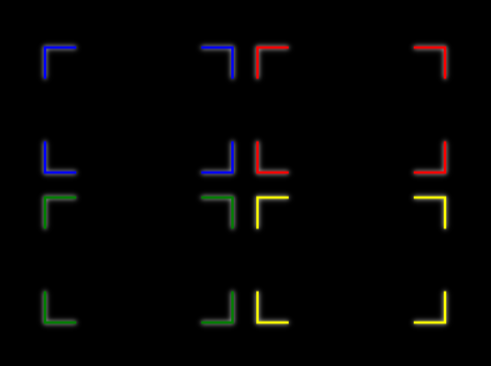
<canvas id="myCanvas" width="400" height="300" style="background: black;"></canvas>

import graphicjs from 'graphicjs';

// Draw the corners of a rectangle
const myCanvas = document.querySelector('#myCanvas');
const shadowColor = 'white';
const shadowBlur = 4;
graphicjs.drawRectangleCorners(myCanvas, 40, 40, 150, 100, { lineColor: 'blue', shadowBlur, shadowColor });
graphicjs.drawRectangleCorners(myCanvas, 210, 40, 150, 100, { lineColor: 'red', shadowBlur, shadowColor });
graphicjs.drawRectangleCorners(myCanvas, 40, 160, 150, 100, { lineColor: 'green', shadowBlur, shadowColor });
graphicjs.drawRectangleCorners(myCanvas, 210, 160, 150, 100, { lineColor: 'yellow', shadowBlur, shadowColor });
<canvas id="myCanvas" width="400" height="300" style="background: black;"></canvas>

import graphicjs from 'graphicjs';

//  Draw a string on the canvas.
const myCanvas = document.querySelector('#myCanvas');
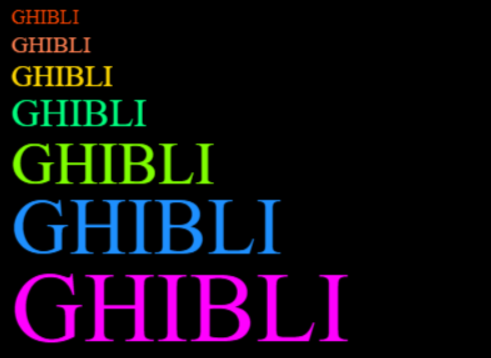
graphicjs.drawText(myCanvas, 'GHIBLI', 10, 10, { font: '1em Times New Roman', color: 'orangered' });
graphicjs.drawText(myCanvas, 'GHIBLI', 10, 31, { font: '1.17em Times New Roman', color: 'coral' });
graphicjs.drawText(myCanvas, 'GHIBLI', 10, 54, { font: '1.5em Times New Roman', color: 'gold' });
graphicjs.drawText(myCanvas, 'GHIBLI', 10, 80, { font: '2em Times New Roman', color: 'springgreen' });
graphicjs.drawText(myCanvas, 'GHIBLI', 10, 113, { font: '3em Times New Roman', color: 'chartreuse' });
graphicjs.drawText(myCanvas, 'GHIBLI', 10, 157, { font: '4em Times New Roman', color: 'dodgerblue' });
graphicjs.drawText(myCanvas, 'GHIBLI', 10, 215, { font: '5em Times New Roman', color: 'fuchsia' });
<canvas id="myCanvas" width="400" height="300" style="background: black;"></canvas>

import graphicjs from 'graphicjs';

// Returns a random integer from min to max
function randInt(min, max) {
  min = Math.ceil(min);
  max = Math.floor(max);
  return Math.floor(Math.random() * (max - min)) + min;
}

// Returns a random color
function randColor() {
  return `hsl(${Math.random() * 360}, 100%, 55%)`;
}

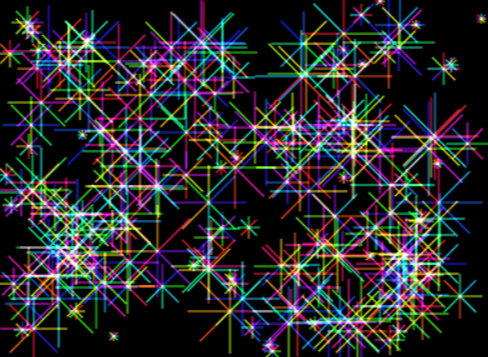
// Draw sparks
function drawSpark() {
  const rad = Math.PI * 2 / 8;
  const radius = randInt(4, 40);
  const x = randInt(radius, parseInt(myCanvas.width, 10) - radius);
  const y = randInt(radius, parseInt(myCanvas.height, 10) - radius);
  for (let i=1; i<9; i++) {
    graphicjs.drawLine(myCanvas,
      x,
      y,
      Math.cos(rad * i) * radius + x,
      Math.sin(rad * i) * radius + y,
      { color: randColor() });
  }
}

//  Draw a line.
const myCanvas = document.querySelector('#myCanvas');
myCanvas.getContext('2d').globalCompositeOperation = 'lighter';
for (let i=0; i<196; i++) drawSpark();
<canvas id="canvas"></canvas>

import graphicjs from 'graphicjs';

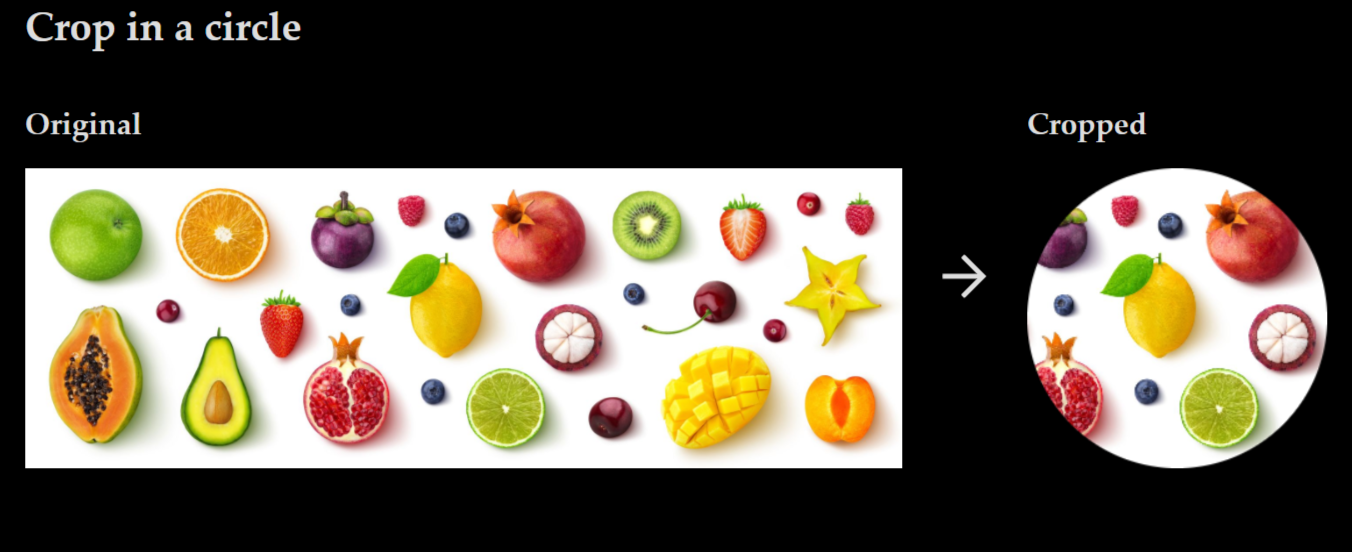
// Crop the image in a circle
const croppedImg = await graphicjs.cropCircle('sample.jpg', { size: 240 });
const canvas = document.querySelector('#canvas');
canvas.width = croppedImg.width;
canvas.height = croppedImg.height;
canvas.getContext('2d').drawImage(croppedImg, 0, 0);
[1.0.1] - 2020-09-21
Added a method to crop the image in a circle.

<canvas id="canvas"></canvas>

import graphicjs from 'graphicjs';

// Crop the image in a circle
const croppedImg = await graphicjs.cropCircle('sample.jpg', { size: 240 });
const canvas = document.querySelector('#canvas');
canvas.width = croppedImg.width;
canvas.height = croppedImg.height;
canvas.getContext('2d').drawImage(croppedImg, 0, 0);
FAQs
This is a module for manipulating media elements and for graphics processing.
We found that graphicjs demonstrated a not healthy version release cadence and project activity because the last version was released a year ago. It has 1 open source maintainer collaborating on the project.
Did you know?

Socket for GitHub automatically highlights issues in each pull request and monitors the health of all your open source dependencies. Discover the contents of your packages and block harmful activity before you install or update your dependencies.

Security News
Bun 1.2 enhances its JavaScript runtime with 90% Node.js compatibility, built-in S3 and Postgres support, HTML Imports, and faster, cloud-first performance.
Security News
Biden's executive order pushes for AI-driven cybersecurity, software supply chain transparency, and stronger protections for federal and open source systems.

Security News
Fluent Assertions is facing backlash after dropping the Apache license for a commercial model, leaving users blindsided and questioning contributor rights.