Security News
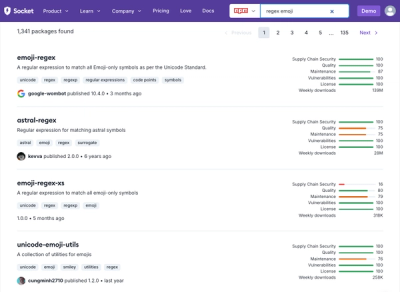
Weekly Downloads Now Available in npm Package Search Results
Socket's package search now displays weekly downloads for npm packages, helping developers quickly assess popularity and make more informed decisions.
Composable, responsive React-based data visualization.
The visual presentation of quantitative data has always been a challenge on the web, and how to adapt to the world of responsive design is still unclear. During the COVID-19 pandemic, many of us spent too much time consulting graphs and charts that were either hard to use, misleading/inaccurate, or both. The smaller the screen, the more frustrating to the user. Adapting a chart to a screen of unknown size might seem an impossible task - but interactivity gives us an added dimension to create data experiences which are just as content-rich, and just as accurate, regardless of the pixels available.
Hypocube is partly a distillation of a few years publishing scientific papers, and a few more as a freelance frontend developer serving research organizations. It is lessons learned from working at the interface of science and the web. It is also a passion project I started in the dark pandemic winter of 2020-21. In a time when we've never had access to more data, how we present that data matters more than ever.
Add Hypocube to your existing React project:
npm i --save hypocube
Create a component:
import { Chart, XAxis, YAxis, BarVerticalSeries } from 'hypocube';

const MyChart = () => (
  <Chart
    width={300}
    height={100}
    // the bounds of the chart, relative to the actual data:
    view={[0, 0, 4, 5]}
    isCanvas={false}
    chartStyle={{
      dataBoxFill: 'blue',
      // makes the width of the boxes dependent on the total width available:
      dataBoxThickness: ({ pxWidth }) => pxWidth / 10,
    }}
  >
    <XAxis />
    <YAxis />
    <BarVerticalSeries
      data={[
        [1, 3],
        [2, 2],
        [3, 5],
      ]}
    />
  </Chart>;
);
And render your chart with:
<MyChart />
or
ReactDOM.render(<MyChart />, document.getElementById('root'));
FAQs
Composable, responsive React-based data visualization.
The npm package hypocube receives a total of 4 weekly downloads. As such, hypocube popularity was classified as not popular.
We found that hypocube demonstrated a healthy version release cadence and project activity because the last version was released less than a year ago. It has 1 open source maintainer collaborating on the project.
Did you know?

Socket for GitHub automatically highlights issues in each pull request and monitors the health of all your open source dependencies. Discover the contents of your packages and block harmful activity before you install or update your dependencies.

Security News
Socket's package search now displays weekly downloads for npm packages, helping developers quickly assess popularity and make more informed decisions.

Security News
A Stanford study reveals 9.5% of engineers contribute almost nothing, costing tech $90B annually, with remote work fueling the rise of "ghost engineers."

Research
Security News
Socket’s threat research team has detected six malicious npm packages typosquatting popular libraries to insert SSH backdoors.