Security News
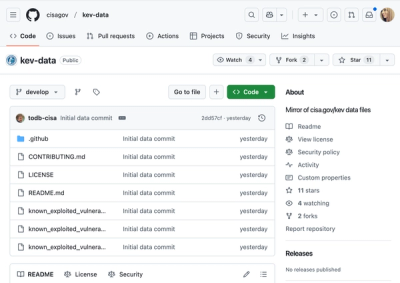
CISA Brings KEV Data to GitHub
CISA's KEV data is now on GitHub, offering easier access, API integration, commit history tracking, and automated updates for security teams and researchers.
By Sarah Gooding - Jan 29, 2025
jscharting
Advanced tools
![]()
JSCharting is a JavaScript chart library for visualizing your data across all devices and platforms. Every JSCharting license includes the full suite of 150+ advanced chart types plus Gantt charts, JavaScript Org Charts, interactive stock and finance charts, seamless grid and calendar charts, JavaScript maps, and micro charts all for no additional charge. JSCharting has all the features you need and many you don't yet know you want.
Example Charts: Chart Types | Feature Examples
Visit code.jscharting.com for a list of available releases.
<script src="https://code.jscharting.com/latest/jscharting.js"></script>
The latest release can be downloaded here.
See npm documentation to get started with npm.
npm install --save jscharting
The npm package folder jscharting/dist/ includes all the necessary charting JavaScript files and resources such as icons, polyfills, and mapping data files. The chart loads these resources dynamically as needed. The content of this folder should be accessible through http, so when building, copy this folder to a destination in the output website.
If the chart detects a script tag pointing to the main jscharting.js file, it will assume the rest of the resources are located in the same place and will load them from there.
If the JSC namespace is imported from the jscharting.js file as a module, the chart will not know where resources
are located and will load them from the CDN. If debug: true chart option is set, a warning message will note that the
chart is using the CDN. In order to use local resources, point the chart baseUrl option to the location of the local
copy of the jscharting/dist/ folder.
To avoid setting the baseUrl property on every chart instance, it can be set as a global default like so:
JSC.defaults({ baseUrl: './js/jsc/' });
A wrapper module can be used to apply the baseUrl and any other default options that should be used globally such as debug, or styling options. All subsequent charts can import this wrapper instead of the chart itself to ensure the default options are always applied.
import * as JSC from "jscharting";

JSC.defaults({ baseUrl: './js/jsc/' });

export default JSC;
Add a target div element to you HTML page for the chart to render in and specify a CSS height setting.
<div id="chartDiv" style="max-width: 500px; height: 300px;"></div>
The chart will automatically conform to the container size by default.
Create an instance of a chart with some static data.
const chart = new JSC.Chart('chartDiv', {
  type: 'column',
  series:[{
	name: 'Teams',
    points: [{ x: 'A', y: 10 }, { x: 'B', y: 5 }]
  }],
});

Edit in CodePen
JSC.fetch() is an alias for the standard JavaScript fetch() function and includes a polyfill for IE11. Use this function to effortlessly retrieve chart data from your disk.
JSC.fetch('./data.csv')
    .then(response => response.text())
    .then(text => {
        //Use csv text
    });
Data in CSV, TSV, or delimiter-separated values format can be converted to JSON. Refer to the fetch(), CSV, and JSON tutorial for more information.
let data = JSC.csv2Json(
 'date,actual,goal\n1/1/2023,5409,7000\n1/8/2023,4893,7000'
);
// ->
//[{date: 1672552800000, actual: 5409, goal: 7000},
//{date: 1673157600000, actual: 4893, goal: 7000}]
let points = data.map(d => {
  return { x: d.date, y: d.actual };
});
//-> [{ x: 1672552800000, y: 5409 }, { x: 1673157600000, y: 4893 }]
const chart = new JSC.Chart('chartDiv', {
   /* Set the x axis scale to time. */
   xAxis_scale_type: 'time',
   /* Pass points to the series */
   series: [{
       points: points
   }]
});

Edit in CodePen
(5 min read to hit the ground running)
The JSCharting API is designed to be user-friendly. The chart selects default options that are intuitive, reducing the need for customization.
You can set chart types through the chart type property:
const chart = new JSC.Chart('divId', { type: 'horizontal column' });
There are a variety of chart types, series types, and modifiers that can be combined in the "type" property.
horizontal, pie, radar, map, organizational, calendar, full list
column, line, area, bubble, candlestick, full list
A few illustrated examples of type settings:
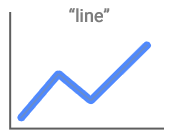
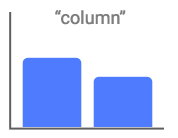
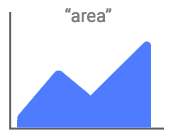
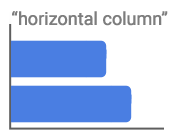
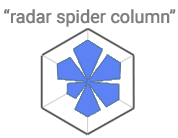
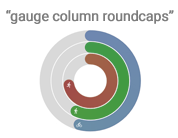
Be sure to check out our chart types gallery for examples and usage guidance.
Chart options can be set in the chart constructor,
const chart = new JSC.Chart('divId', { /*options*/ });
or at any time after the chart is rendered.
chart.options({ /*options*/ });
JSCharting provides a declarative API with options such as
chart.options({ title: { label: { text: 'title text' }}});
For convenience, property paths can be combined into single property names as shown:
chart.options({ title_label_text: 'title text' });
chart.options({ legend_visible: false });
// Less Detail
chart.options({ legend_template: '%icon %name' });
// More Detail
chart.options({ legend_template: '%average %sum %icon %name' });
Refer to the Token Reference Tutorial for a comprehensive list of over 54 available tokens, listed under the 'Series Tokens' section.

Try it out in this CodePen
The code snippet below sets a series palette, which results in each point in a series having a corresponding entry in the legend box.
chart.options({ defaultSeries_palette: 'default' });


chart.options({
    /* Title text */
    title_label_text: 'Title text',
    /* Axis label text */
    xAxis_label_text: 'Time',
    yAxis_label_text: 'Steps',
    /* Point labels */
    defaultPoint_label_text: '%yValue',
    /* Annotations */
    annotations:[{
        position: 'top',
        label_text: 'Annotation text'
    }]
});

Using Labels tutorial.
Do you need a user interface control to adjust a chart setting or test a line of code in real-time?
Traditionally, you would have to create an HTML element and link its events to JavaScript code, but this process can be made much easier by using the integrated UI controls provided by JSCharting. This allows you to add simple UI elements without any HTML required.
JSC.Chart('chartDiv', {
    toolbar_items: {
        'Click Me': {
            events_click: function(){ alert('Button clicked'); }
        }}
});
Try it in CodePen.
Toolbar & UiItems tutorial.
[3.4.0] - 2023-2-14
exploded option has been deprecated in favor of the point selected option.FAQs
JavaScript charting library
The npm package jscharting receives a total of 1,426 weekly downloads. As such, jscharting popularity was classified as popular.
We found that jscharting demonstrated a not healthy version release cadence and project activity because the last version was released a year ago. It has 1 open source maintainer collaborating on the project.
Did you know?

Socket for GitHub automatically highlights issues in each pull request and monitors the health of all your open source dependencies. Discover the contents of your packages and block harmful activity before you install or update your dependencies.
Security News
CISA's KEV data is now on GitHub, offering easier access, API integration, commit history tracking, and automated updates for security teams and researchers.
Security News
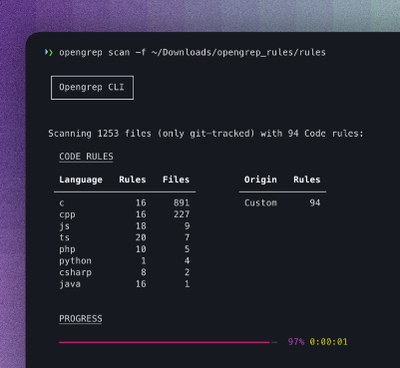
Opengrep forks Semgrep to preserve open source SAST in response to controversial licensing changes.

Security News
Critics call the Node.js EOL CVE a misuse of the system, sparking debate over CVE standards and the growing noise in vulnerability databases.