Research
Security News
Threat Actor Exposes Playbook for Exploiting npm to Build Blockchain-Powered Botnets
A threat actor's playbook for exploiting the npm ecosystem was exposed on the dark web, detailing how to build a blockchain-powered botnet.
mapd-charting
Advanced tools
A multi-dimensional charting library built to work natively with crossfilter and rendered using d3.js.
Dimensional charting built to work natively with crossfilter rendered using d3.js.


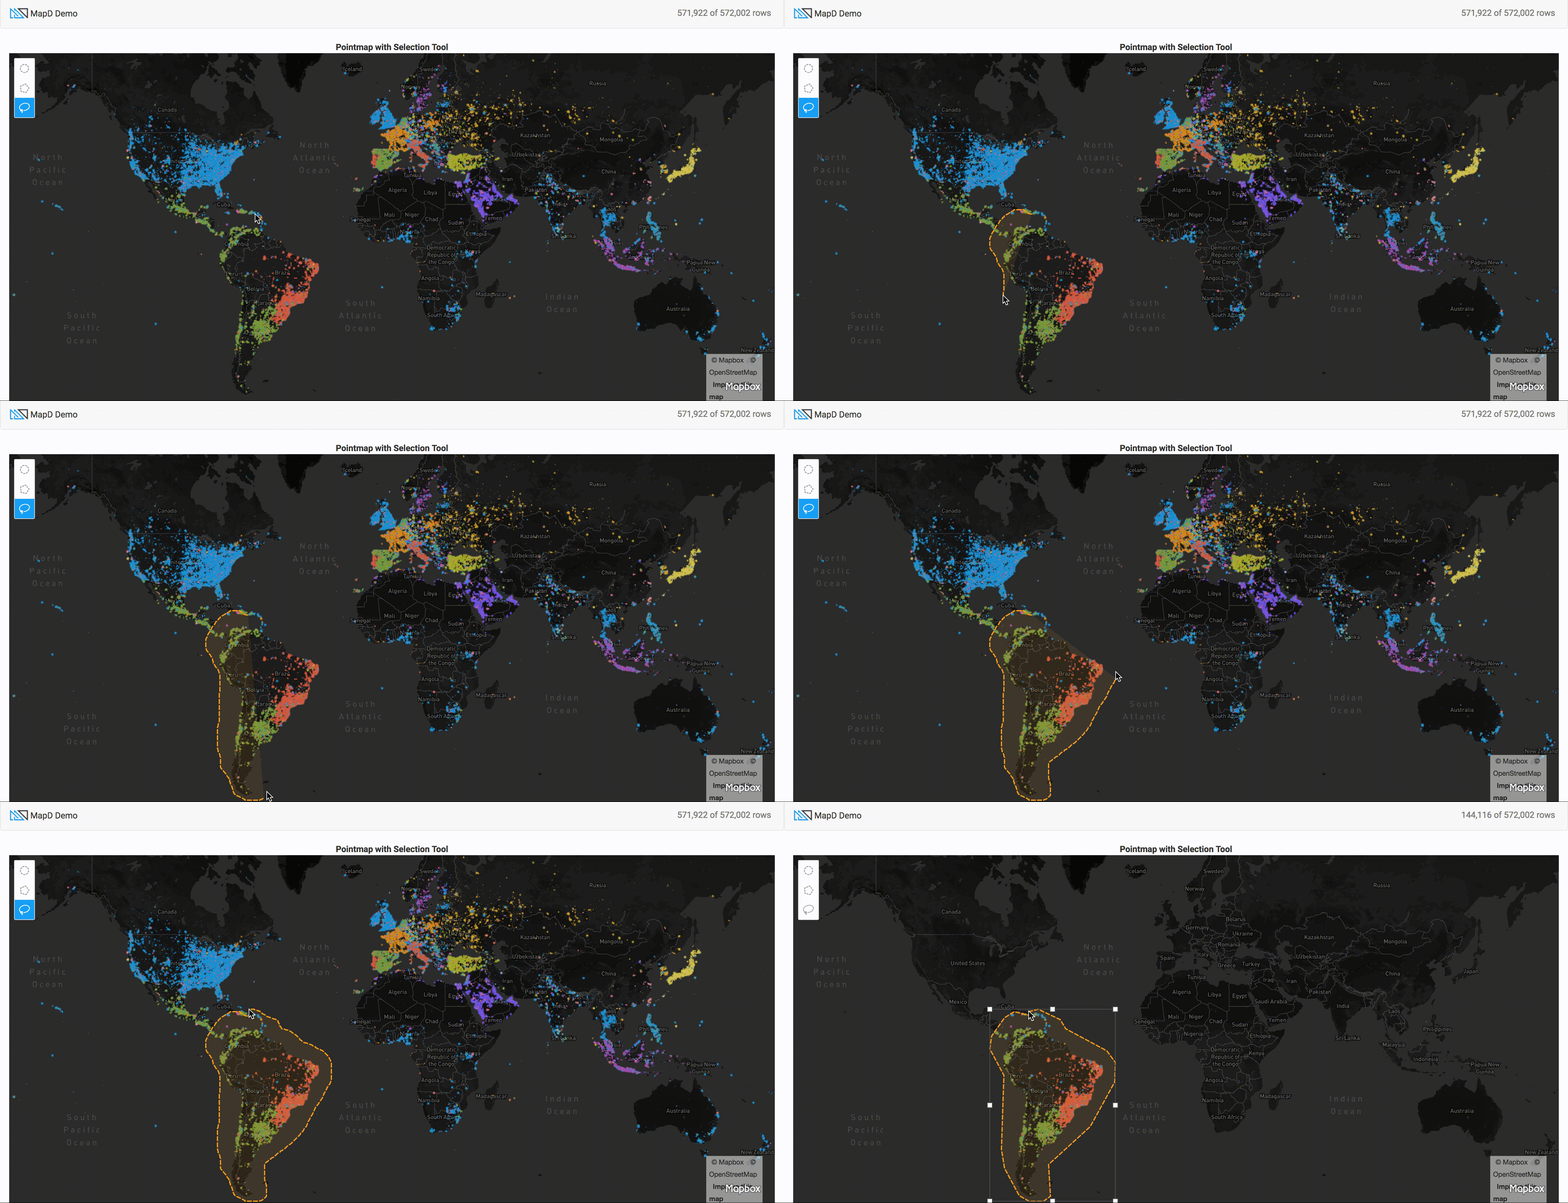
Visit our examples page for ideas of what can be created MapD Charting
npm install #downloads all dependencies and devDependencies
npm run start
or
npm run watch
MapD-Charting is a superfast charting library that works natively with crossfilter that is based off dc.js. It is designed to work with MapD-Connector and MapD-Crossfilter to create charts instantly with our MapD-Core SQL Database. Please see examples for further understanding to quickly create interactive charts.
Our Tweetmap Demo was made only using MapD-Charting.
Visit our API Docs for additional information on MapD Charting
New components in MapD-Charting should be unit-tested and linted. All tests will be in the same folder as the new component.
+-- src
|   +-- /mixins/new-mixin-component.js
|   +-- /mixins/new-mixin-component.unit.spec.js
The linter and all tests run on
npm run test
To check only unit-tests run:
npm run test:unit
Please lint all your code in mapd-charting/. The lint config file can be found in .eslintrc.json. For new components, please fix all lint warnings and errors.
| Command | Description |
|---|---|
npm run start | Copies files for examples and then serves the example |
npm run build | Runs webpack and builds js and css in /dist |
npm run docs | Creates and opens docs |
npm run test | Runs both linting and unit tests |
npm run clean | Removes node modules, dist, docs, and example files |
The charting library uses documentation.js for API documentation. Docs can be built and viewed locally with the npm run docs command.
Interested in contributing? We'd love for you to help! Check out Contributing.MD
FAQs
A multi-dimensional charting library built to work natively with crossfilter and rendered using d3.js.
We found that mapd-charting demonstrated a not healthy version release cadence and project activity because the last version was released a year ago. It has 1 open source maintainer collaborating on the project.
Did you know?

Socket for GitHub automatically highlights issues in each pull request and monitors the health of all your open source dependencies. Discover the contents of your packages and block harmful activity before you install or update your dependencies.

Research
Security News
A threat actor's playbook for exploiting the npm ecosystem was exposed on the dark web, detailing how to build a blockchain-powered botnet.

Security News
NVD’s backlog surpasses 20,000 CVEs as analysis slows and NIST announces new system updates to address ongoing delays.

Security News
Research
A malicious npm package disguised as a WhatsApp client is exploiting authentication flows with a remote kill switch to exfiltrate data and destroy files.