Security News
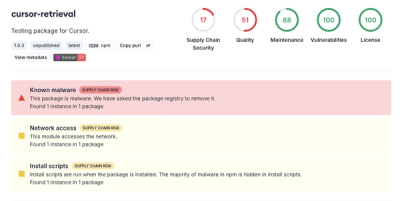
The Risks of Misguided Research in Supply Chain Security
Snyk's use of malicious npm packages for research raises ethical concerns, highlighting risks in public deployment, data exfiltration, and unauthorized testing.
node-memwatch-x
Advanced tools
node-memwatch: Leak Detection and Heap Diffing for Node.JSnode-memwatch is here to help you detect and find memory leaks in
Node.JS code. It provides:
A leak event, emitted when it appears your code is leaking memory.
A stats event, emitted occasionally, giving you
data describing your heap usage and trends over time.
A HeapDiff class that lets you compare the state of your heap between
two points in time, telling you what has been allocated, and what
has been released.
npm install node-memwatchor
git clone https://github.com/eduardbcom/node-memwatch.gitThere are a growing number of tools for debugging and profiling memory usage in Node.JS applications, but there is still a need for a platform-independent native module that requires no special instrumentation. This module attempts to satisfy that need.
To get started, import node-memwatch like so:
var memwatch = require('node-memwatch');
You can then subscribe to leak events. A leak event will be
emitted when your heap usage has increased for five consecutive
garbage collections:
memwatch.on('leak', function(info) { ... });
The info object will look something like:
{ start: Fri, 29 Jun 2012 14:12:13 GMT,
  end: Fri, 29 Jun 2012 14:12:33 GMT,
  growth: 67984,
  reason: 'heap growth over 5 consecutive GCs (20s) - 11.67 mb/hr' }
The best way to evaluate your memory footprint is to look at heap
usage right after V8 performs garbage collection. memwatch does
exactly this - it checks heap usage only after GC to give you a stable
baseline of your actual memory usage.
When V8 performs a garbage collection (technically, we're talking
about a full GC with heap compaction), memwatch will emit a stats
event.
memwatch.on('stats', function(stats) { ... });
The stats data will look something like this:
{
  "num_full_gc": 17,
  "num_inc_gc": 8,
  "heap_compactions": 8,
  "estimated_base": 2592568,
  "current_base": 2592568,
  "min": 2499912,
  "max": 2592568,
  "usage_trend": 0
}
estimated_base and usage_trend are tracked over time. If usage
trend is consistently positive, it indicates that your base heap size
is continuously growing and you might have a leak.
V8 has its own idea of when it's best to perform a GC, and under a
heavy load, it may defer this action for some time. To aid in
speedier debugging, memwatch provides a gc() method to force V8 to
do a full GC and heap compaction.
So far we have seen how memwatch can aid in leak detection. For
leak isolation, it provides a HeapDiff class that takes two snapshots
and computes a diff between them. For example:
// Take first snapshot
var hd = new memwatch.HeapDiff();

// do some things ...

// Take the second snapshot and compute the diff
var diff = hd.end();
The contents of diff will look something like:
{
  "before": { "nodes": 11625, "size_bytes": 1869904, "size": "1.78 mb" },
  "after":  { "nodes": 21435, "size_bytes": 2119136, "size": "2.02 mb" },
  "change": { "size_bytes": 249232, "size": "243.39 kb", "freed_nodes": 197,
    "allocated_nodes": 10007,
    "details": [
      { "what": "String",
        "size_bytes": -2120,  "size": "-2.07 kb",  "+": 3,    "-": 62
      },
      { "what": "Array",
        "size_bytes": 66687,  "size": "65.13 kb",  "+": 4,    "-": 78
      },
      { "what": "LeakingClass",
        "size_bytes": 239952, "size": "234.33 kb", "+": 9998, "-": 0
      }
    ]
  }
}
The diff shows that during the sample period, the total number of
allocated String and Array classes decreased, but Leaking Class
grew by 9998 allocations. Hmmm.
You can use HeapDiff in your on('stats') callback; even though it
takes a memory snapshot, which triggers a V8 GC, it will not trigger
the stats event itself. Because that would be silly.
Please see the Issues to share suggestions and contribute!
FAQs
Keep an eye on your memory usage, and discover and isolate leaks.
We found that node-memwatch-x demonstrated a not healthy version release cadence and project activity because the last version was released a year ago. It has 1 open source maintainer collaborating on the project.
Did you know?

Socket for GitHub automatically highlights issues in each pull request and monitors the health of all your open source dependencies. Discover the contents of your packages and block harmful activity before you install or update your dependencies.

Security News
Snyk's use of malicious npm packages for research raises ethical concerns, highlighting risks in public deployment, data exfiltration, and unauthorized testing.

Research
Security News
Socket researchers found several malicious npm packages typosquatting Chalk and Chokidar, targeting Node.js developers with kill switches and data theft.

Security News
pnpm 10 blocks lifecycle scripts by default to improve security, addressing supply chain attack risks but sparking debate over compatibility and workflow changes.