node-red-contrib-chartjs
Chart.js Node-RED node

Description
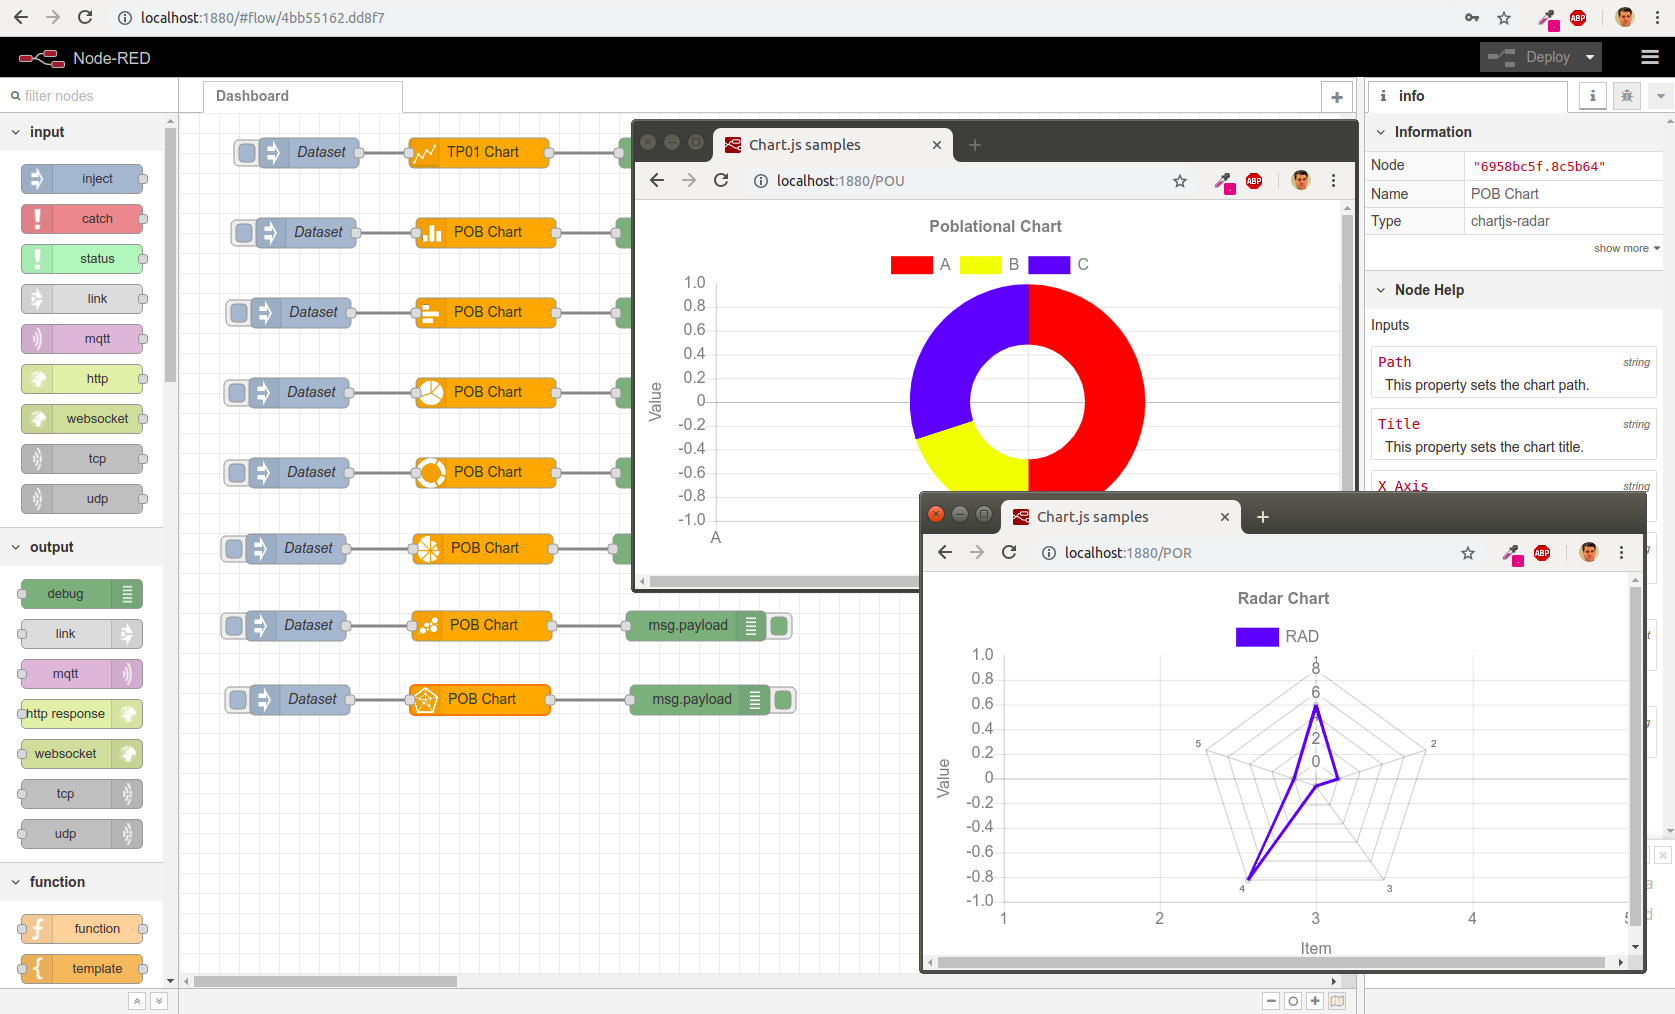
This node permit to use Charts from Chart.js from Node-RED. The objective is create a new node-red path for each chart created, this path could be configured and updated at runtime.
Installation
npm install node-red-contrib-chartjs --save
Chart implemented
- Line Chart

- Vertical Bar Chart

- Horizontal Bar Chart

- Pie Chart

- Doughnut Chart

- Polar Area Chart

- Bubble Chart

- Radar Chart

Chart configuration
The Chart attributes are:
- Path: The Chart path to be access
- Tittle: The tittle of the chart
- X Axis: The X axis name
- Y Axis: The Y axis name
- Payloas: The dataset to be drawed
The Chart Payload attributes are:
- channel: channel label legend name
- color: color of the chart line
- dataset: dataset array.
The Payload attributes are:
- x: x axis dataset value
- y: y axis dataset value
Check the node help to know the Dataset structure for each chart
A Line Chart dataset could be like this:
{
    "channel": "Population",
    "color": "Green",
    "dataset": [
        {
            "x": "Europe",
            "y": 741
        },
        {
            "x": "Australia",
            "y": 24
        },
        {
            "x": "Africa",
            "y": 1.2
        },
        {
            "x": "America",
            "y": 325
        },
        {
            "x": "Asia",
            "y": 4.4
        }
    ]
}
Dependencies
Server side
Client side
- socker.io-client: socket.io client side
- jquery: multipurpose javascript library
- Chart.js: Simple yet flexible JavaScript charting for designers & developers
Example
Under example folder you have all json flows to be imported in your node-red instance and test the node.


