Security News
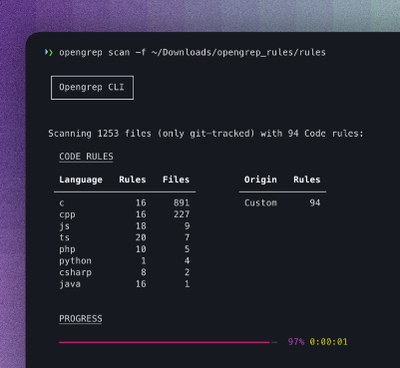
Opengrep Emerges as Open Source Alternative Amid Semgrep Licensing Controversy
Opengrep forks Semgrep to preserve open source SAST in response to controversial licensing changes.
perfume.js
Advanced tools
Tiny web performance monitoring library which reports field data back to your favorite analytics tool.

Speed is a feature, and to deliver it we need to understand the many factors and fundamental limitations that are at play. In a few words, if we can measure it, we can improve it.
English | 简体中文
Perfume is a tiny, web performance monitoring library which reports field data back to your favorite analytics tool.
Perfume leverage the latest Performance APIs for measuring performance that matters! Also known as field data, they allow to understand what real-world users are actually experiencing.

npm (https://www.npmjs.com/package/perfume.js):
npm install perfume.js --save
You can import the generated bundle to use the whole library generated:
import Perfume from 'perfume.js';
Universal Module Definition:
import Perfume from 'node_modules/perfume.js/dist/perfume.umd.min.js';
Metrics like Navigation Timing, Network Information, FP, FCP, FID, LCP, CLS and TBT are default reported with Perfume; All results will be reported to the analyticsTracker callback, and the code below is just one way on how you can organize your tracking, feel free to tweak it as you prefer.
const perfume = new Perfume({
  analyticsTracker: (options) => {
    const { metricName, data, navigatorInformation } = options;
    switch (metricName) {
      case 'navigationTiming':
        if (data && data.timeToFirstByte) {
          myAnalyticsTool.track('navigationTiming', data);
        }
        break;
      case 'networkInformation':
        if (data && data.effectiveType) {
          myAnalyticsTool.track('networkInformation', data);
        }
        break;
      case 'storageEstimate':
        myAnalyticsTool.track('storageEstimate', data);
        break;
      case 'firstPaint':
        myAnalyticsTool.track('firstPaint', { duration: data });
        break;
      case 'firstContentfulPaint':
        myAnalyticsTool.track('firstContentfulPaint', { duration: data });
        break;
      case 'firstInputDelay':
        myAnalyticsTool.track('firstInputDelay', { duration: data });
        break;
      case 'largestContentfulPaint':
        myAnalyticsTool.track('largestContentfulPaint', { duration: data });
        break;
      case 'largestContentfulPaintUntilHidden':
        myAnalyticsTool.track('largestContentfulPaintUntilHidden', { duration: data });
        break;
      case 'cumulativeLayoutShift':
        myAnalyticsTool.track('cumulativeLayoutShift', { duration: data });
        break;
      case 'cumulativeLayoutShiftUntilHidden':
        myAnalyticsTool.track('cumulativeLayoutShiftUntilHidden', { duration: data });
        break;
      case 'totalBlockingTime':
        myAnalyticsTool.track('totalBlockingTime', { duration: data });
        break;
      case 'totalBlockingTime5S':
        myAnalyticsTool.track('totalBlockingTime5S', { duration: data });
        break;
      case 'totalBlockingTime10S':
        myAnalyticsTool.track('totalBlockingTime10S', { duration: data });
        break;
      default:
        myAnalyticsTool.track(metricName, { duration: data });
        break;
    }
  },
  logging: false
});
Coo coo coo cool, let's learn something new.
Navigation Timing collects performance metrics for the life and timings of a network request. Perfume helps expose some of the key metrics you might need.
Navigation Timing is run by default.
// Perfume.js: navigationTiming { ... timeToFirstByte: 192.65 }
FP is the exact time the browser renders anything as visually different from what was on the screen before navigation, e.g. a background change after a long blank white screen time.
First Paint is run by default.
// Perfume.js: firstPaint 1482.00 ms
FCP is the exact time the browser renders the first bit of content from the DOM, which can be anything from an important image, text, or even the small SVG at the bottom of the page.
First Contentful Paint is run by default.
// Perfume.js: firstContentfulPaint 2029.00 ms
Largest Contentful Paint (LCP) is an important, user-centric metric for measuring perceived load speed because it marks the point in the page load timeline when the page's main content has likely loaded—a fast LCP helps reassure the user that the page is useful.
We end the LCP measure at two points: when FID happen and when the page's lifecycle state changes to hidden.
// Perfume.js: largestContentfulPaint 2429.00 ms
// Perfume.js: largestContentfulPaintUntilHidden 2429.00 ms
FID measures the time from when a user first interacts with your site (i.e. when they click a link, tap on a button) to the time when the browser is actually able to respond to that interaction.
First Input Delay is run by default.
// Perfume.js: firstInputDelay 3.20 ms
CLS is an important, user-centric metric for measuring visual stability because it helps quantify how often users experience unexpected layout shifts—a low CLS helps ensure that the page is delightful.
We end the CLS measure at two points: when FID happen and when the page's lifecycle state changes to hidden.
// Perfume.js: cumulativeLayoutShiftUntil 0.13
// Perfume.js: cumulativeLayoutShiftUntilHidden 0.13
Total Blocking Time (TBT) is an important, user-centric metric for measuring load responsiveness because it helps quantify the severity of how non-interactive a page is prior to it becoming reliably interactive—a low TBT helps ensure that the page is usable.
// Perfume.js: totalBlockingTime 347.07 ms
// Perfume.js: totalBlockingTime5S 427.14 ms
// Perfume.js: totalBlockingTime10S 427.14 ms
Resource Timing collects performance metrics for document-dependent resources. Stuff like style sheets, scripts, images, et cetera. Perfume helps expose all PerformanceResourceTiming entries and group data data consumption by Kb used.
const perfume = new Perfume({
  resourceTiming: true,
  analyticsTracker: ({ metricName, data }) => {
    myAnalyticsTool.track(metricName, data);
  })
});
// Perfume.js: dataConsumption { "css": 185.95, "fetch": 0, "img": 377.93, ... , "script": 8344.95 }
Performance.mark (User Timing API) is used to create an application-defined peformance entry in the browser's performance entry buffer.
const perfume = new Perfume({
  analyticsTracker: ({ metricName, data }) => {
    myAnalyticsTool.track(metricName, data);
  })
});
perfume.start('fibonacci');
fibonacci(400);
perfume.end('fibonacci');
// Perfume.js: fibonacci 0.14 ms

This metric mark the point, immediately after creating a new component, when the browser renders pixels to the screen.
const perfume = new Perfume({
  analyticsTracker: ({ metricName, data }) => {
    myAnalyticsTool.track(metricName, data);
  })
});
perfume.start('togglePopover');
$(element).popover('toggle');
perfume.endPaint('togglePopover');
// Perfume.js: togglePopover 10.54 ms

Default options provided to Perfume.js constructor.
const options = {
  resourceTiming: false,
  // Analytics
  analyticsTracker: options => {},
  // Logging
  logPrefix: "Perfume.js:"
  logging: true,
  maxMeasureTime: 15000,
};
npm run test: Run test suitenpm run build: Generate bundles and typingsnpm run lint: Lints code
Made with ☕️ by @zizzamia and I want to thank some friends and projects for the work they did:
This project exists thanks to all the people who contribute.
Thank you to all our backers! 🙏 [Become a backer]
Code and documentation copyright 2020 Leonardo Zizzamia. Code released under the MIT license. Docs released under Creative Commons.

Leonardo Zizzamia |
5.0.0-rc.9 (2020-4-25)
FAQs
Web performance library for measuring all User-centric performance metrics, including the latest Web Vitals.
The npm package perfume.js receives a total of 10,312 weekly downloads. As such, perfume.js popularity was classified as popular.
We found that perfume.js demonstrated a healthy version release cadence and project activity because the last version was released less than a year ago. It has 1 open source maintainer collaborating on the project.
Did you know?

Socket for GitHub automatically highlights issues in each pull request and monitors the health of all your open source dependencies. Discover the contents of your packages and block harmful activity before you install or update your dependencies.

Security News
Opengrep forks Semgrep to preserve open source SAST in response to controversial licensing changes.

Security News
Critics call the Node.js EOL CVE a misuse of the system, sparking debate over CVE standards and the growing noise in vulnerability databases.

Security News
cURL and Go security teams are publicly rejecting CVSS as flawed for assessing vulnerabilities and are calling for more accurate, context-aware approaches.