react-gauge-component
React Gauge Chart Component for data visualization.
This is forked from @Martin36/react-gauge-chart 0b24a45.
🔑Key differences
- Added min/max values
- Added grafana based gauge
- Added arcs limits in value instead of percent
- Added inner/outer ticks to the gauge for reference of the values
- Added blob pointer type
- Added arrow pointer type
- Added tooltips on hover for the arcs
- Added arc with linear gradient colors
- Full responsive
- All render flow fixed and optimized avoiding unecessary resource usage. Performance test, left is original: https://user-images.githubusercontent.com/45375617/239447916-217630e7-8e34-4a3e-a59f-7301471b9855.png
- Refactored project structure to separated files
- Refactored to Typescript
- Added complex objects for better modulation and organization of the project
- Fixed Rerenderings making arcs to be repeated in different sizes
- Fixed needing to set height bug
- Fixed needing to set id bug
Demo
https://antoniolago.github.io/react-gauge-component/
Usage
Install it by running npm install react-gauge-component --save or yarn add react-gauge-component. Then to use it:
import GaugeComponent from 'react-gauge-component';
import { GaugeComponent } from 'react-gauge-component';
<GaugeComponent />
For next.js you'll have to do dynamic import:
import dynamic from "next/dynamic";
const GaugeComponent = dynamic(() => import('react-gauge-component'), { ssr: false });
<GaugeComponent />
Examples
Simple Gauge.
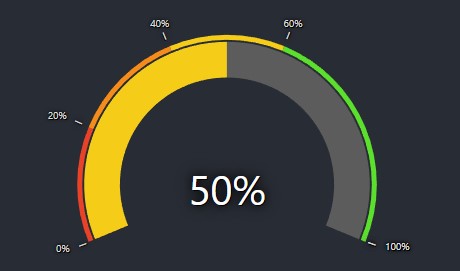
Show Simple Gauge code
Simple Gauge
<GaugeComponent
  arc={{
    subArcs: [
      {
        limit: 20,
        color: '#EA4228',
        showTick: true
      },
      {
        limit: 40,
        color: '#F58B19',
        showTick: true
      },
      {
        limit: 60,
        color: '#F5CD19',
        showTick: true
      },
      {
        limit: 100,
        color: '#5BE12C',
        showTick: true
      },
    ]
  }}
  value={50}
/>
Custom Bandwidth Gauge.
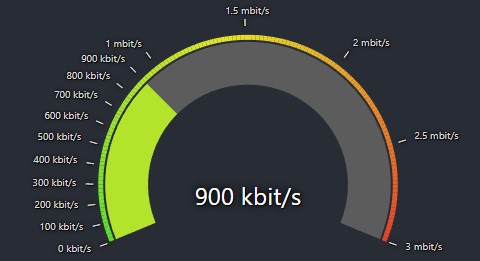
Show Bandwidth Gauge code
Bandwidth Gauge
const kbitsToMbits = (value) => {
  if (value >= 1000) {
    value = value / 1000;
    if (Number.isInteger(value)) {
      return value.toFixed(0) + ' mbit/s';
    } else {
      return value.toFixed(1) + ' mbit/s';
    }
  } else {
    return value.toFixed(0) + ' kbit/s';
  }
}
<GaugeComponent
  arc={{
    nbSubArcs: 150,
    colorArray: ['#5BE12C', '#F5CD19', '#EA4228'],
    width: 0.3,
    padding: 0.003
  }}
  labels={{
    valueLabel: {
      style: {fontSize: 40},
      formatTextValue: kbitsToMbits
    },
    tickLabels: {
      type: "outer",
      ticks: [
        { value: 100 },
        { value: 200 },
        { value: 300 },
        { value: 400 },
        { value: 500 },
        { value: 600 },
        { value: 700 },
        { value: 800 },
        { value: 900 },
        { value: 1000 },
        { value: 1500 },
        { value: 2000 },
        { value: 2500 },
        { value: 3000 },
      ],
      defaultTickValueConfig: {
        formatTextValue: kbitsToMbits
      }
    }
  }}
  value={900}
  maxValue={3000}
/>
Custom Temperature Gauge
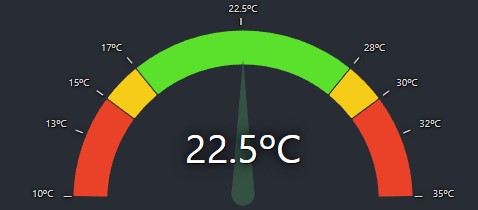
Show Temperature Gauge code
Temperature Gauge
<GaugeComponent
type="semicircle"
arc={{
width: 0.2,
padding: 0.005,
cornerRadius: 1,
subArcs: [
{
limit: 15,
color: '#EA4228',
showTick: true,
tooltip: {
text: 'Too low temperature!'
},
onClick: () => console.log("AAAAAAAAAAAAAAAAAAAAAAAAAAAAAAAA"),
onMouseMove: () => console.log("BBBBBBBBBBBBBBBBBBBBBBBBBBBBBBBB"),
onMouseLeave: () => console.log("CCCCCCCCCCCCCCCCCCCCCCCCCCCCCCCC"),
},
{
limit: 17,
color: '#F5CD19',
showTick: true,
tooltip: {
text: 'Low temperature!'
}
},
{
limit: 28,
color: '#5BE12C',
showTick: true,
tooltip: {
text: 'OK temperature!'
}
},
{
limit: 30, color: '#F5CD19', showTick: true,
tooltip: {
text: 'High temperature!'
}
},
{
color: '#EA4228',
tooltip: {
text: 'Too high temperature!'
}
}
]
}}
pointer={{
color: '#345243',
length: 0.80,
width: 15,
}}
labels={{
valueLabel: { formatTextValue: value => value + 'ºC' },
tickLabels: {
type: 'outer',
defaultTickValueConfig: {
formatTextValue: (value: any) => value + 'ºC' ,
style: {fontSize: 10}
},
ticks: [
{ value: 13 },
{ value: 22.5 },
{ value: 32 }
],
}
}}
value={22.5}
minValue={10}
maxValue={35}
/>
Gauge with blob.
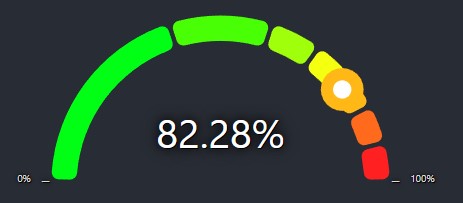
Show Gauge with blob code
Custom gauge with blob
<GaugeComponent
  type="semicircle"
  arc={{
    colorArray: ['#00FF15', '#FF2121'],
    padding: 0.02,
    subArcs:
      [
        { limit: 40 },
        { limit: 60 },
        { limit: 70 },
        {},
        {},
        {},
        {}
      ]
  }}
  pointer={{type: "blob", animationDelay: 0 }}
  value={50}
/>
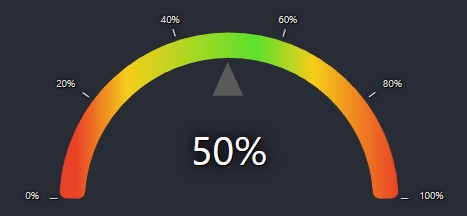
Gradient with arrow gauge.
Show Gradient with arrow code
Custom gradient with arrow
<GaugeComponent
  id="gauge-component4"
  arc={{
    gradient: true,
    width: 0.15,
    padding: 0,
    subArcs: [
      {
        limit: 15,
        color: '#EA4228',
        showTick: true
      },
      {
        limit: 37,
        color: '#F5CD19',
        showTick: true
      },
      {
        limit: 58,
        color: '#5BE12C',
        showTick: true
      },
      {
        limit: 75,
        color: '#F5CD19',
        showTick: true
      },
      { color: '#EA4228' }
    ]
  }}
  value={50}
  pointer={{type: "arrow", elastic: true}}
/>
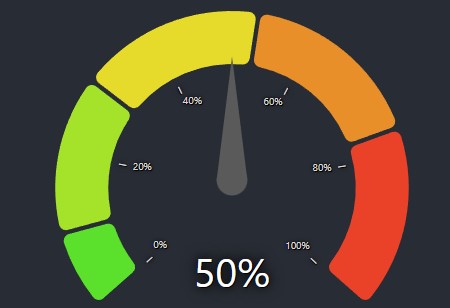
Custom radial gauge.
Show Custom Radial Gauge code
Custom Radial Gauge
<GaugeComponent
  value={50}
  type="radial"
  labels={{
    tickLabels: {
      type: "inner",
      ticks: [
        { value: 20 },
        { value: 40 },
        { value: 60 },
        { value: 80 },
        { value: 100 }
      ]
    }
  }}
  arc={{
    colorArray: ['#5BE12C','#EA4228'],
    subArcs: [{limit: 10}, {limit: 30}, {}, {}, {}],
    padding: 0.02,
    width: 0.3
  }}
  pointer={{
    elastic: true,
    animationDelay: 0
  }}
/>
API
Props:
type: string: The type of the gauge, values can be "grafana", "semicircle and "radial". Default: "grafana".id: string: A unique identifier for the div surrounding the chart. Default: "".className: string: Adds a className to the div container. Default: "gauge-component-class".style: React.CSSProperties: Adds a style object to the div container. Default: {width: 100}.marginInPercent: number | {left: number, right: number, top: number, bottom: number}: Sets the margin for the chart inside the containing SVG element. Default:
"grafana": { top: 0.12, bottom: 0.00, left: 0.07, right: 0.07 }.
"semicircle": { top: 0.08, bottom: 0.00, left: 0.07, right: 0.07 }
"radial": { top: 0.07, bottom: 0.00, left: 0.07, right: 0.07 }value: number: The value of the gauge. Default: 33.minValue: number: The minimum value of the gauge. Default: 0.maxValue: number: The maximum value of the gauge. Default: 100.arc: object: The arc of the gauge.
cornerRadius: number: The corner radius of the arc. Default: 7.padding: number: The padding between subArcs, in rad. Default: 0.05.width: number: The width of the arc given in percent of the radius. Default:
"grafana": 0.25.
"semicircle": 0.15
"radial": 0.2.nbSubArcs: number: The number of subArcs. This overrides subArcs. Default: undefinedcolorArray: Array<string>: The colors of the arcs. This overrides subArcs colors. Default: undefinedemptyColor: string: The default color of the grafana's "empty" subArc color. Default: "#5C5C5C"gradient: boolean: This will draw a single arc with all colors provided in subArcs, using limits as references to draw the linear-gradient result. (limits may not be accurate in this mode) Default: false.subArcs: Array<object>: The subArcs of the gauge.
limit: number: The subArc length using value as reference. When no limits or lengths are defined will auto-calculate remaining arcs limits. Example of valid input: subArcs: [{limit: 50}, {limit: 100}] this will render 2 arcs 50/50length: number: The subArc length in percent of the arc (as the behavior of the original project). Example of
a valid input: subArcs: [{length: 0.50}, {length: 0.50}], this will render 2 arcs 50/50color: string: The subArc color. When not provided, it will use default subArc's colors and interpolate first and last colors when subArcs number is greater than colorArray.showTick: boolean: Whether or not to show the tick. Default: false.tooltip: object: Tooltip object.
text: stringtext that will be displayed in the tooltip when hovering the subArc.style: React.CSSProperties: Overrides tooltip styles.
onClick: (event: any) => void: onClick callback. Default: undefined.onMouseMove: (event: any) => void: onMouseMove callback. Default: undefined.onMouseLeave: (event: any) => void: onMouseLeave callback. Default: undefined.
subArcs default value:
          [
            { limit: 33, color: "#5BE12C"},
            { limit: 66, color: "#F5CD19"},
            { color: "#EA4228"},
          ]
pointer: object: The value pointer of the gauge. Grafana gauge have it's own pointer logic, but animation properties will be applied.
type: string This can be "needle", "blob" or "arrow". Default: "needle"hide: boolean Enabling this flag will hide the pointer. Default: falsecolor: string: The color of the pointer. Default: #464A4FbaseColor: string: The color of the base of the pointer. Default: #464A4Flength: number: The length of the pointer 0-1, 1 being the outer radius length. Default: 0.70animate: boolean: Whether or not to animate the pointer. Default: trueelastic: boolean: Whether or not to use elastic pointer. Default: falseanimationDuration: number: The duration of the pointer animation. Default: 3000animationDelay: number: The delay of the pointer animation. Default: 100width: number: The width of the pointer. Default: 20strokeWidth: number: Only available for blob type. Set the width of the stroke. Default: 8
labels: object: The labels of the gauge.
valueLabel: object: The center value label of the gauge.
matchColorWithArc: boolean: when enabled valueLabel color will match current arc colorformatTextValue: (value: any) => string: The format of the value label. Default: undefined.style: React.CSSProperties: Overrides valueLabel styles. Default: {fontSize: "35px", fill: "#fff", textShadow: "black 1px 1px 0px, black 0px 0px 2.5em, black 0px 0px 0.2em"}maxDecimalDigits: number: this is the number of decimal digits the value will round up to. Default: 2hide: boolean: Whether or not to hide the value label. Default: false.
tickLabels: object The tickLabels of the gauge.
type: string: This makes the ticks "inner" or "outer" the radius. Default:"outer"hideMinMax: boolean: Whether or not to hide the min and max labels. Default: falseticks: Array<object>: The ticks of the gauge. When not provided, it will use default gauge ticks with five values.
value: number: The value of the tick.valueConfig: object: The config of the tick's value label. When not provided, it will use default config.lineConfig: object: The config of the tick's line. When not provided, it will use default config.
defaultTickValueConfig: object: The default config of the tick's value label.
formatTextValue: (value: any) => string: The format of the tick's value label. Default: undefinedstyle: React.CSSProperties: Overrides tick's valueConfig styles. Default: {fontSize: "10px", fill: "#464A4F", textShadow: "black 1px 1px 0px, black 0px 0px 2.5em, black 0px 0px 0.2em"}maxDecimalDigits: number: this is the number of decimal digits the value will round up to. Default: 2hide: boolean: Whether or not to hide the tick's value label. Default: false
defaultTickLineConfig: object: The default config of the tick's line.
width: number: The width of the tick's line. Default: 1length: number: The length of the tick's line. Default: 7color: string: The color of the tick's line. Default: rgb(173 172 171)distanceFromArc: number: The distance of the tick's line from the arc. Default: 3hide: boolean: Whether or not to hide the tick's line. Default: false
Colors for the chart
The 'colorArray' prop could either be specified as an array of hex color values, such as ["#FF0000", "#00FF00", "#0000FF"] where
each arc would a color in the array (colors are assigned from left to right). If that is the case, then the length of the array
must match the number of levels in the arc.
If the number of colors does not match the number of levels, then the first and the last color from the colors array will
be selected and the arcs will get colors that are interpolated between those. The interpolation is done using d3.interpolateHsl.


