
Security News
Deno 2.2 Improves Dependency Management and Expands Node.js Compatibility
Deno 2.2 enhances Node.js compatibility, improves dependency management, adds OpenTelemetry support, and expands linting and task automation for developers.
react-gauge-component
Advanced tools
React Gauge Chart Component for data visualization.
This is forked from @Martin36/react-gauge-chart 0b24a45. Key differences:
https://antoniolago.github.io/react-gauge-component/
After release 1.1.20 "marks" were renamed to "ticks" please refer to the documentation below
Install it by running npm install react-gauge-component --save or yarn add react-gauge-component. Then to use it:
import GaugeComponent from 'react-gauge-component'

//Component with default values
<GaugeComponent />
For next.js you'll have to do dynamic import:
import dynamic from "next/dynamic";
const GaugeComponent = dynamic(() => import('react-gauge-component'), { ssr: false });

//Component with default values
<GaugeComponent />
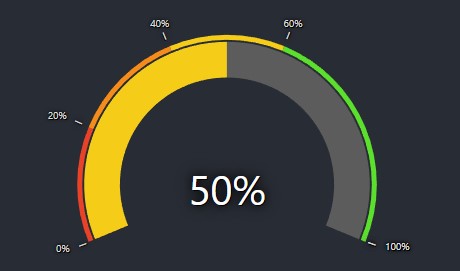
<GaugeComponent
  arc={{
    subArcs: [
      {
        limit: 20,
        color: '#EA4228',
        showTick: true
      },
      {
        limit: 40,
        color: '#F58B19',
        showTick: true
      },
      {
        limit: 60,
        color: '#F5CD19',
        showTick: true
      },
      {
        limit: 100,
        color: '#5BE12C',
        showTick: true
      },
    ]
  }}
  value={50}
/>
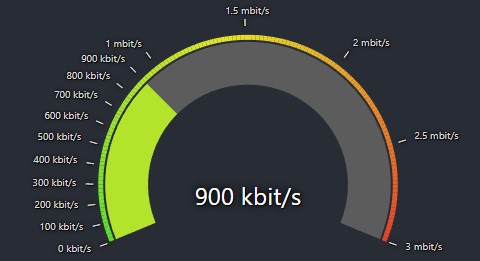
const kbitsToMbits = (value) => {
  if (value >= 1000) {
    value = value / 1000;
    if (Number.isInteger(value)) {
      return value.toFixed(0) + ' mbit/s';
    } else {
      return value.toFixed(1) + ' mbit/s';
    }
  } else {
    return value.toFixed(0) + ' kbit/s';
  }
}
<GaugeComponent
  arc={{
    nbSubArcs: 150,
    colorArray: ['#5BE12C', '#F5CD19', '#EA4228'],
    width: 0.3,
    padding: 0.003
  }}
  labels={{
    valueLabel: {
      fontSize: 40,
      formatTextValue: kbitsToMbits
    },
    tickLabels: {
      type: "outer",
      ticks: [
        { value: 100 },
        { value: 200 },
        { value: 300 },
        { value: 400 },
        { value: 500 },
        { value: 600 },
        { value: 700 },
        { value: 800 },
        { value: 900 },
        { value: 1000 },
        { value: 1500 },
        { value: 2000 },
        { value: 2500 },
        { value: 3000 },
      ],
      valueConfig: {
        formatTextValue: kbitsToMbits
      }
    }
  }}
  value={900}
  maxValue={3000}
/>
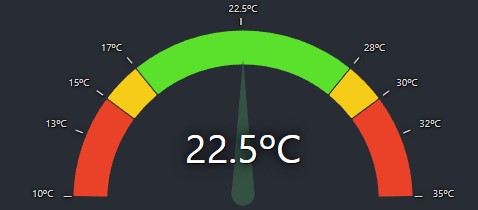
<GaugeComponent
  type="semicircle"
  arc={{
    width: 0.2,
    padding: 0.005,
    cornerRadius: 1,
    // gradient: true,
    subArcs: [
      {
        limit: 15,
        color: '#EA4228',
        showTick: true,
        tooltip: {
          text: 'Too low temperature!'
        },
        onClick: () => console.log("AAAAAAAAAAAAAAAAAAAAAAAAAAAAAAAA"),
        onMouseMove: () => console.log("BBBBBBBBBBBBBBBBBBBBBBBBBBBBBBBB"),
        onMouseLeave: () => console.log("CCCCCCCCCCCCCCCCCCCCCCCCCCCCCCCC"),
      },
      {
        limit: 17,
        color: '#F5CD19',
        showTick: true,
        tooltip: {
          text: 'Low temperature!'
        }
      },
      {
        limit: 28,
        color: '#5BE12C',
        showTick: true,
        tooltip: {
          text: 'OK temperature!'
        }
      },
      {
        limit: 30, color: '#F5CD19', showTick: true,
        tooltip: {
          text: 'High temperature!'
        }
      },
      {
        color: '#EA4228',
        tooltip: {
          text: 'Too high temperature!'
        }
      }
    ]
  }}
  pointer={{
    color: '#345243',
    length: 0.80,
    width: 15,
    // elastic: true,
  }}
  labels={{
    valueLabel: { formatTextValue: value => value + 'ºC' },
    tickLabels: {
      type: 'outer',
      valueConfig: { formatTextValue: value => value + 'ºC', fontSize: 10 },
      ticks: [
        { value: 13 },
        { value: 22.5 },
        { value: 32 }
      ],
    }
  }}
  value={22.5}
  minValue={10}
  maxValue={35}
/>
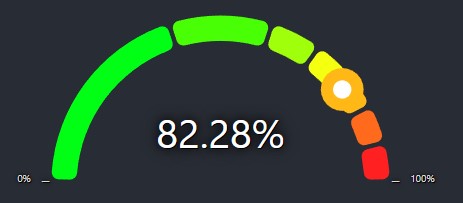
<GaugeComponent
  type="semicircle"
  arc={{
    colorArray: ['#00FF15', '#FF2121'],
    padding: 0.02,
    subArcs:
      [
        { limit: 40 },
        { limit: 60 },
        { limit: 70 },
        {},
        {},
        {},
        {}
      ]
  }}
  pointer={{type: "blob", animationDelay: 0 }}
  value={50}
/>
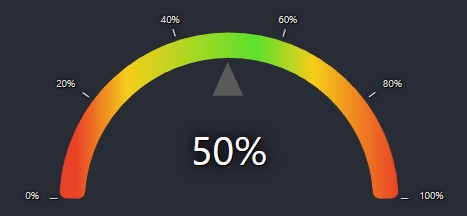
<GaugeComponent
  id="gauge-component4"
  arc={{
    gradient: true,
    width: 0.15,
    padding: 0,
    subArcs: [
      {
        limit: 15,
        color: '#EA4228',
        showTick: true
      },
      {
        limit: 37,
        color: '#F5CD19',
        showTick: true
      },
      {
        limit: 58,
        color: '#5BE12C',
        showTick: true
      },
      {
        limit: 75,
        color: '#F5CD19',
        showTick: true
      },
      { color: '#EA4228' }
    ]
  }}
  value={50}
  pointer={{type: "arrow", elastic: true}}
/>
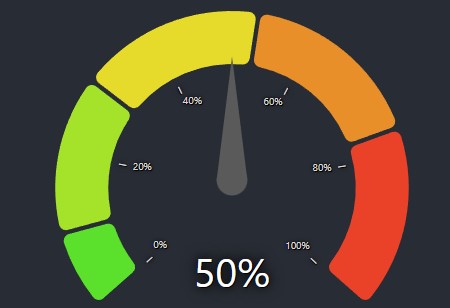
<GaugeComponent
  value={50}
  type="radial"
  labels={{
    tickLabels: {
      type: "inner",
      ticks: [
        { value: 20 },
        { value: 40 },
        { value: 60 },
        { value: 80 },
        { value: 100 }
      ]
    }
  }}
  arc={{
    colorArray: ['#5BE12C','#EA4228'],
    subArcs: [{limit: 10}, {limit: 30}, {}, {}, {}],
    padding: 0.02,
    width: 0.3
  }}
  pointer={{
    elastic: true,
    animationDelay: 0
  }}
/>
type: string: The type of the gauge, values can be "grafana", "semicircle and "radial". Default: "grafana".id: string: A unique identifier for the div surrounding the chart. Default: "".className: string: Adds a className to the div container. Default: "gauge-component-class".style: React.CSSProperties: Adds a style object to the div container. Default: {width: 100}.marginInPercent: number | {left: number, right: number, top: number, bottom: number}: Sets the margin for the chart inside the containing SVG element. Default:
"grafana": { top: 0.12, bottom: 0.00, left: 0.07, right: 0.07 }.
"semicircle": { top: 0.08, bottom: 0.00, left: 0.07, right: 0.07 }
"radial": { top: 0.07, bottom: 0.00, left: 0.07, right: 0.07 }value: number: The value of the gauge. Default: 33.minValue: number: The minimum value of the gauge. Default: 0.maxValue: number: The maximum value of the gauge. Default: 100.arc: object: The arc of the gauge.
cornerRadius: number: The corner radius of the arc. Default: 7.padding: number: The padding between subArcs, in rad. Default: 0.05.width: number: The width of the arc given in percent of the radius. Default:
"grafana": 0.25.
"semicircle": 0.15
"radial": 0.2.nbSubArcs: number: The number of subArcs. This overrides subArcs. Default: undefinedcolorArray: Array<string>: The colors of the arcs. This overrides subArcs colors. Default: undefinedgradient: boolean: This will draw a single arc with all colors provided in subArcs, using limits as references to draw the linear-gradient result. (limits may not be accurate in this mode) Default: false.subArcs: Array<object>: The subArcs of the gauge.
limit: number: The subArc length using value as reference. When no limits or lengths are defined will auto-calculate remaining arcs limits. Example of valid input: subArcs: [{limit: 50}, {limit: 100}] this will render 2 arcs 50/50length: number: The subArc length in percent of the arc (as the behavior of the original project). Example of
a valid input: subArcs: [{length: 0.50}, {length: 0.50}], this will render 2 arcs 50/50color: string: The subArc color. When not provided, it will use default subArc's colors and interpolate first and last colors when subArcs number is greater than colorArray.showTick: boolean: Whether or not to show the tick. Default: false.tooltip: object: Tooltip object.
text: stringtext that will be displayed in the tooltip when hovering the subArc.style: React.CSSProperties: Overrides tooltip styles.onClick: (event: any) => void: onClick callback. Default: undefined.onMouseMove: (event: any) => void: onMouseMove callback. Default: undefined.onMouseLeave: (event: any) => void: onMouseLeave callback. Default: undefined.
          [
            { limit: 33, color: "#5BE12C"},
            { limit: 66, color: "#F5CD19"},
            { color: "#EA4228"},
          ]
pointer: object: The value pointer of the gauge. Grafana gauge have it's own pointer logic, but animation properties will be applied.
type: string This can be "needle", "blob" or "arrow". Default: "needle"color: string: The color of the pointer. Default: #464A4FbaseColor: string: The color of the base of the pointer. Default: #464A4Flength: number: The length of the pointer 0-1, 1 being the outer radius length. Default: 0.70animate: boolean: Whether or not to animate the pointer. Default: trueelastic: boolean: Whether or not to use elastic pointer. Default: falseanimationDuration: number: The duration of the pointer animation. Default: 3000animationDelay: number: The delay of the pointer animation. Default: 100width: number: The width of the pointer. Default: 20labels: object: The labels of the gauge.
valueLabel: object: The center value label of the gauge.
matchColorWithArc: boolean: when enabled valueLabel color will match current arc colorformatTextValue: (value: any) => string: The format of the value label. Default: undefined.style: React.CSSProperties: Overrides valueLabel styles. Default: {fontSize: "35px", fill: "#fff", textShadow: "black 1px 1px 0px, black 0px 0px 2.5em, black 0px 0px 0.2em"}maxDecimalDigits: number: this is the number of decimal digits the value will round up to. Default: 2hide: boolean: Whether or not to hide the value label. Default: false.tickLabels: object The tickLabels of the gauge.
type: string: This makes the ticks "inner" or "outer" the radius. Default:"outer"hideMinMax: boolean: Whether or not to hide the min and max labels. Default: falseticks: Array<object>: The ticks of the gauge. When not provided, it will use default gauge ticks with five values.
value: number: The value of the tick.valueConfig: object: The config of the tick's value label. When not provided, it will use default config.lineConfig: object: The config of the tick's line. When not provided, it will use default config.defaultTickValueConfig: object: The default config of the tick's value label.
formatTextValue: (value: any) => string: The format of the tick's value label. Default: undefinedstyle: React.CSSProperties: Overrides tick's valueConfig styles. Default: {fontSize: "10px", fill: "#464A4F", textShadow: "black 1px 1px 0px, black 0px 0px 2.5em, black 0px 0px 0.2em"}maxDecimalDigits: number: this is the number of decimal digits the value will round up to. Default: 2hide: boolean: Whether or not to hide the tick's value label. Default: falsedefaultTickLineConfig: object: The default config of the tick's line.
char: string: The char of the tick. Default: '_'style: React.CSSProperties: Overrides tick's lineConfig styles. Default: {fontSize: "18px", fill: "#464A4F", textShadow: "black 1px 1px 0px, black 0px 0px 2.5em, black 0px 0px 0.2em"}hide: boolean: Whether or not to hide the tick's char. Default: falseThe 'colorArray' prop could either be specified as an array of hex color values, such as ["#FF0000", "#00FF00", "#0000FF"] where
each arc would a color in the array (colors are assigned from left to right). If that is the case, then the length of the array
must match the number of levels in the arc.
If the number of colors does not match the number of levels, then the first and the last color from the colors array will
be selected and the arcs will get colors that are interpolated between those. The interpolation is done using d3.interpolateHsl.
FAQs
Gauge component for React
The npm package react-gauge-component receives a total of 20,638 weekly downloads. As such, react-gauge-component popularity was classified as popular.
We found that react-gauge-component demonstrated a healthy version release cadence and project activity because the last version was released less than a year ago. It has 0 open source maintainers collaborating on the project.
Did you know?

Socket for GitHub automatically highlights issues in each pull request and monitors the health of all your open source dependencies. Discover the contents of your packages and block harmful activity before you install or update your dependencies.

Security News
Deno 2.2 enhances Node.js compatibility, improves dependency management, adds OpenTelemetry support, and expands linting and task automation for developers.

Security News
React's CRA deprecation announcement sparked community criticism over framework recommendations, leading to quick updates acknowledging build tools like Vite as valid alternatives.

Security News
Ransomware payment rates hit an all-time low in 2024 as law enforcement crackdowns, stronger defenses, and shifting policies make attacks riskier and less profitable.