Security News
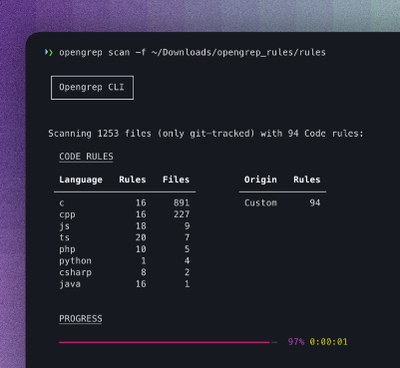
Opengrep Emerges as Open Source Alternative Amid Semgrep Licensing Controversy
Opengrep forks Semgrep to preserve open source SAST in response to controversial licensing changes.
react-liquidchart
Advanced tools
A Nice looking liquid chart done with d3 and react, based off http://bl.ocks.org/brattonc/5e5ce9beee483220e2f6
There is also another really nice version here
npm install react-liquidchart
For now, this will have to do.
import React, { Component } from 'react';
import { render } from 'react-dom';
import LiquidChart from 'react-liquidchart';

const stops = [
  <stop key={1} stopColor="someColor1" offset="5%" />
  <stop key={2} stopColor="someColor2" offset="50%" />,
  <stop key={3} stopColor="someColor3" offset="85%" />,
];

class ChartLiquid extends Component {
  constructor() {
    super();
  }

  render() {
    return (
      <div
        style={{
          width: '100%',
          height: '500px',
        }}
      >
        <LiquidChart
            responsive
            legend="Percentage of Completed Tasks"
            value={Math.random() * 100}
            showDecimal
            amplitude={4}
            frequency={2}
            animationTime={2000}
            animationWavesTime={2250}
            gradient={{
              type: 1,
              x1: 0,
              x2: 0,
              y1: 100,
              y2: 0,
              stops,
            }}
            postfix="%"
            legendFontSize={0.1}
          />
      </div>
    );
  }
}
render(<ChartLiquid />, document.getElementById('app'));
| Name | Type | Default | Description |
|---|---|---|---|
| Width | number | null | The width of the chart, used if responsive is false |
| height | number | null | The width of the chart, used if responsive is false |
| responsive | bool | true | If set to true then the element will fill out into parent container, and resize on window dimension change |
| Value | number | 0 | The value, tops at 100 and 0 is the minimum |
| animationWavesTime | number | null | The speed of the wave animation, going back and forth |
| animationTime | number | 2000 | milliseconds for animation when updating value |
| animationEase | string | 'easeCubicInOut' | The name of the d3 easing function, other values like, easeBack, easeBackInOut, easeSinInOut, easeExpInOut. See d3 easing page for more ideas. |
| outerBound | number | 0.9 | This is the outerRadius of the chart where 1 would be 100% of the radius and 0 would be 0% of the radius.. |
| innerBound | number | 0.8 | The innerwidth of the outerpath surronding the liquid, again 0.8 would be 80% of the radius. |
| margin | number | 0.025 | The margin between the outer path and the liquid, here 0.025 would be 2.5% |
| amplitude | number | 4 | The Amplitude X * sine(frequency) part of the formula |
| frequency | number | 2 | The frequency, how many full circles are in the chart. |
| waveScaleLimit | bool | true | This is in the original, this will create a scale that limits the wave height close to 0 or 100 |
| outerStyle | shape | { fill: 'rgb(23,139,202)'} | The style of the outerarc fill and stroke |
| liquidStyle | shape | { fill: 'rgb(23, 139, 202)'} | The style of the liquid, fill and stroke |
| dryStyle | shape | {fill: 'rgb(164, 219, 248)'} | The style of the number that is not in the liquid, fill and stroke |
| wetStyle | shape | {fill: 'rgb(4, 86, 129)'} | The style of the number that is in the liquid, fill and stroke |
| fontSizes | shape | The sizes of the fonts in ratio to the radius. | |
| showDecimal | bool | false | If this is set then the decimal place is shown |
| postfix | string | null | The symbol that goes in the last tspan placeholder |
There are two kinds of animation, the value animation and the back and forth animation. To set the animation you only need to set either the animationTime or the animationEase for value transitions. To set the back and forth animation you need to set the animationWavesTime prop.
Sets the fontsize of the tspans. The values are fractions of the radius.
const fontSize = {
  value: 0.6,
  decimal: 0.3,
  postfix: 0.1,
  legend: 0.1,
};
You can add your own css to the component by targeting the classes that are set.
For an example if I would like to change the font type and the positioning I could do something like this
  .liquid-text {
    transform: translate(0, 40px);
    font-family: Roboto;
  }
This software was available initially under the BSD-2-Clause. The changes are also available under the BSD-2-Clause.
FAQs
A Reusable liquid chart made with d3 and react
The npm package react-liquidchart receives a total of 86 weekly downloads. As such, react-liquidchart popularity was classified as not popular.
We found that react-liquidchart demonstrated a not healthy version release cadence and project activity because the last version was released a year ago. It has 1 open source maintainer collaborating on the project.
Did you know?

Socket for GitHub automatically highlights issues in each pull request and monitors the health of all your open source dependencies. Discover the contents of your packages and block harmful activity before you install or update your dependencies.

Security News
Opengrep forks Semgrep to preserve open source SAST in response to controversial licensing changes.

Security News
Critics call the Node.js EOL CVE a misuse of the system, sparking debate over CVE standards and the growing noise in vulnerability databases.

Security News
cURL and Go security teams are publicly rejecting CVSS as flawed for assessing vulnerabilities and are calling for more accurate, context-aware approaches.